AMD Richland APU Review
 |
Introduction
With the release of the Llano chips in mid-2011 and the Trinity chips in late-2012, the AMD APUs were shown to be the perfect option for the person who wanted a cheap, yet capable system that could be expanded on in the future. They not only offered plenty of CPU power to handle anything a regular user would need, but also enough GPU power on-chip to tackle some gaming. You can pick up one of these chips for a little over $100, pair it with an equally affordable motherboard and RAM, and you have a nice little setup for very little money. You can then expand on it with a dedicated graphics card, more or faster RAM, and even get into some pretty serious overclocking, the sum of which will leave you with a truly powerful machine capable of handling any modern game out there today.
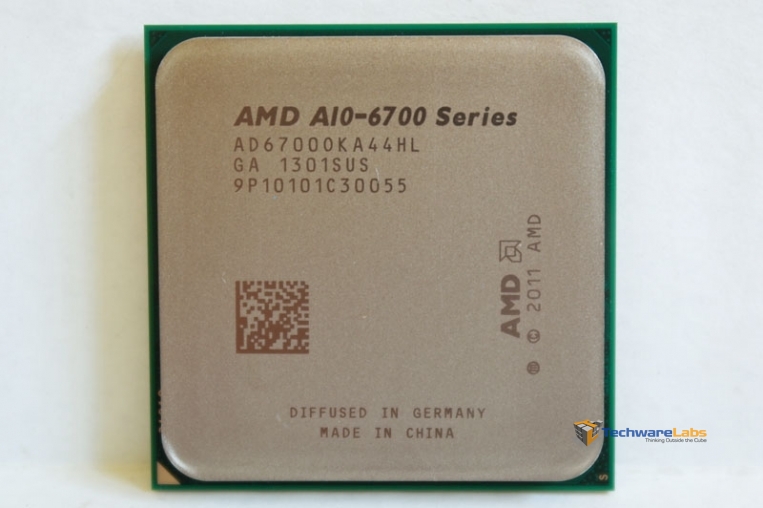
AMD has continued this legacy with its newest line of APUs, Richland. These new chips feature the same proven Piledriver architecture for the CPU side, but an upgrade the the Radeon 8xxx series on the GPU side. On top of that the flagship chip supports faster RAM speeds (2133 MHz up from 1866) and all chips have had frequency bumps and improvements for the Turbo Core feature. Naturally with Richland and Trinity sharing the same architecture, the same FM2 socket it used as well as the A85X chipset. We will be taking a look at the top of the line, unlocked A10-6800k and its locked and downclocked version, the A10-6700. Read on to see the lineup and how they perform.
 |
 |
| |
Features
– Turbo Charged x86 architecture featuring “Piledriver” cores
- Supports up to 4 cores and support for the latest ISA instructions including FMA4/3, AVX, AES, XOP
- Up to 2MB L2 cache per dual-core module (up to 4MB total)
- Max Turbo Frequencies up to 4.4 GHz
- Configurable via AMD OverDrive
– AMD Radeon™ HD 8000 Series GPU Cores
- Featuring VLIW 4 architecture
- Up to 384 shaders
- Up to 844MHz
- Up to 8xAA and 16AF support
- Controllable via AMD OverDrive1
- DirectX®11 Support
– New DDR3-2133 support on A10 APUs
– Enhanced AMD Turbo Core
- More Frequency/Voltage levels for CPU and x86 cores
- Temperature Smart Turbo Core
- New bottleneck detect algorithms
- Controllable via AMD OverDrive1
– UVD and VCE
- Video Encode and Decode Hardware to offload CPU
- AMD Picture Perfect support with HD Post Processing technologies
– Support for latest display technologies
- AMD Eyefinity2 technology for 3+1 monitor support
- Display Port 1.2 support
Specifications
| Tech/Package | 32nm, FM2 socket |
| TDP Configs | 65W and 100W configurations |
| Processor Core | “Piledriver” 32nm HKMG process core (up to 4 cores), up to 128 KB L1 Cache (64 KB Instruction, 64 KB Data) Up to 4 MB L2, 2 x 128-bit FPUs / compute module |
| Memory | Up to DDR3 2133 @ 1.5V |
| Graphics Core | Up to 384 Radeon™ Cores 2.0, DirectX® 11 capable, UVD3, VCE |
| Displays | Digital Display I/F DP0: Display Port, HDMI, DVI Digital Display I/F DP1: Display Port, HDMI, DVI Digital Display I/F DP2: Display Port, HDMI, DVI Additional digital display supported using DP 1.2 daisy-chain connection VGA on FCH |
| Power Management | Multiple low-power states 32-nm process for decreased power consumption System Management Mode (SMM) ACPI-compliant, including support for processor performance states (P-states), processor power states (C-states), and sleep states including S0, S3, S4, and S5 Per compute module power gating (CC6) • PCIe® core power gating PCIe® speed power policy GPU power gating of Radeon™ Cores and video decode (UVD3) Enhanced AMD Turbo Core technology featuring Temperature Smart Turbo Core |
~
Lineup
| APU Model | A10-6800K | A10-6700 | A8-6600K | A8-6500 | A6-6400K |
| AMD Radeon™ Brand | HD 8670D | HD 8670D | HD 8570D | HD 8570D | HD 8470D |
| TDP | 100W | 65W | 100W | 65W | 65W |
| AMD Radeon™ Cores | 384 | 384 | 256 | 256 | 192 |
| GPU Clock Speed MHz | 844 | 844 | 844 | 800 | 800 |
| CPU Cores | 4 | 4 | 4 | 4 | 2 |
| CPU Clock (Turbo/Base) GHz | 4.4/4.1 | 4.3/3.7 | 4.2/3.9 | 4.1/3.5 | 4.1/3.9 |
| Total L2 Cache | 4MB | 4MB | 4MB | 4MB | 1MB |
| Max DDR3 Speed | 2133 | 1866 | 1866 | 1866 | 1866 |
| AMD Turbo Core | Yes | Yes | Yes | Yes | Yes |
| Unlocked | Yes | No | Yes | No | Yes |
| EST Price | $149 | $149 | $120 | $120 | $77 |
 |
|
Test System
- MSI FM2-A85XA-G65
- Corsair Dominator 4 x 2GB @ 1600MHz
- OCZ 700W PSU
- Corsair H100
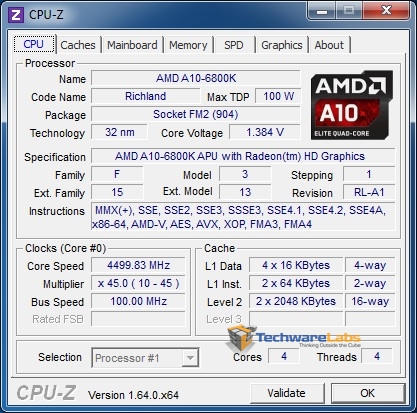
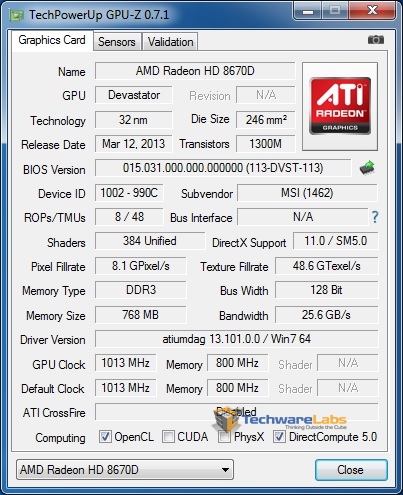
CPU-Z and GPU-Z
 |
 |
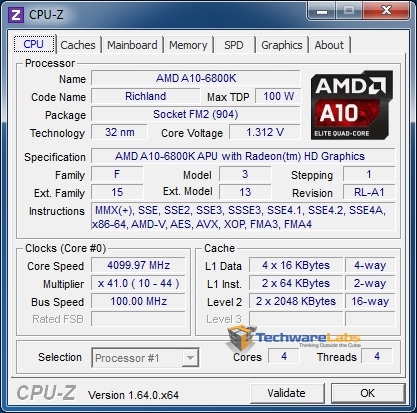
On the left we see the A10-6800k which is clocked at an impressive 4.1 GHz out of the box and can jump up to 4.4 GHz with Turbo Boost. On the right is the 6700 which has slightly lower clocks at 3.7 and 4.3 GHz base and boost speeds respectively. Aside from the obvious clock speed change, the difference between these two chips is that the 6800k is unlocked meaning the multiplier can be adjusted up for overclocking and the 6800k supports faster memory speeds (2133 MHz versus 1866). The 6800k also has a higher TDP at 100W compared to the 6700’s 65W.
 |
Both the 6800k and the 6700 have the same exact GPU, a Radeon HD8670D clocked at 844 MHz with 384 shaders.
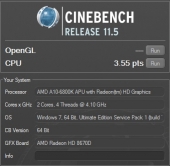
Cinebench
 |
 |
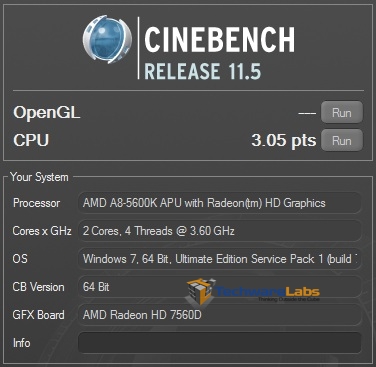 |
| 6800k | 6700 | 5600k |
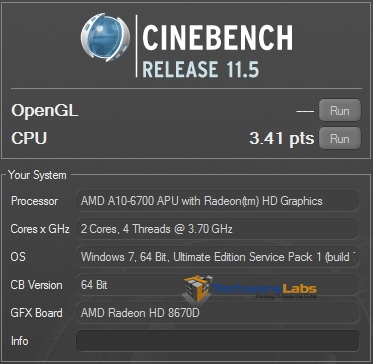
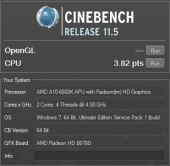
Cinebench tests a systems CPU performance through rendering a complex 2D scene utilizing every core. The 6800k showed a 4% increase over the 6700 due simply to the clock difference between the two chips and both chips showed a fairly significant increase over last generations A8-5600k.
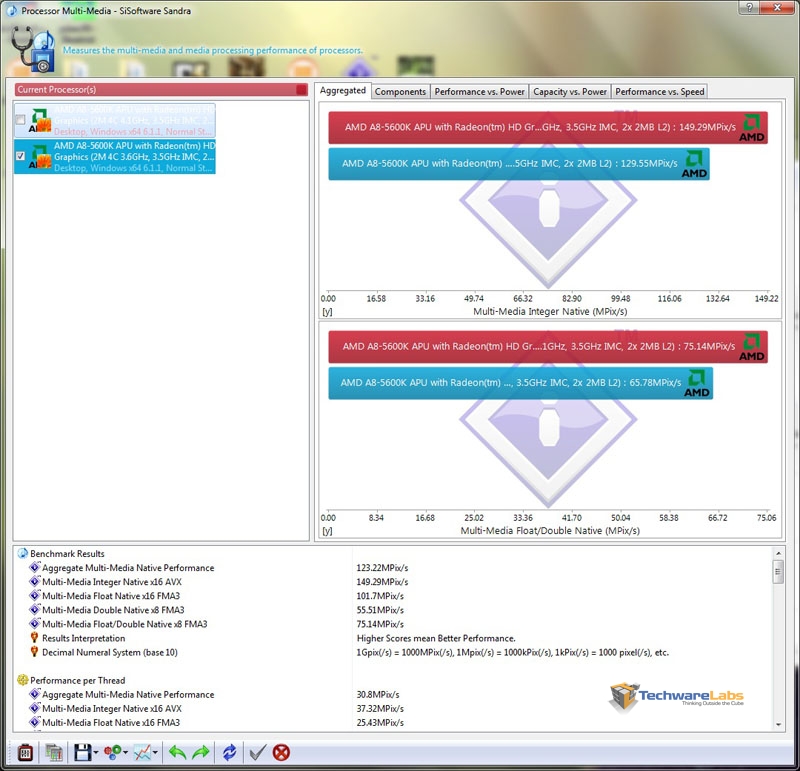
SiSoft Sandra
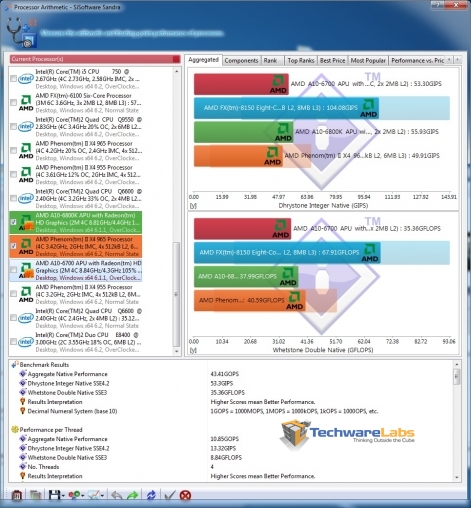 |
 |
| 6800k and 6700 | 5600k (stock and overclocked) |
SiSoft Sandra is a tool capable of testing just about every part of your system. I focused on two CPU intensive benchmarks, arithmetic processing, and multi-media performance. In the arithmetic processing benchmark the 6800k averaged about a 6% increase over the 6700 and a 15% increase over the 5600k at stock clocks. Even when the 5600k is overclocked to the 6800k’s level, the 6800k still beats it by around 4%.
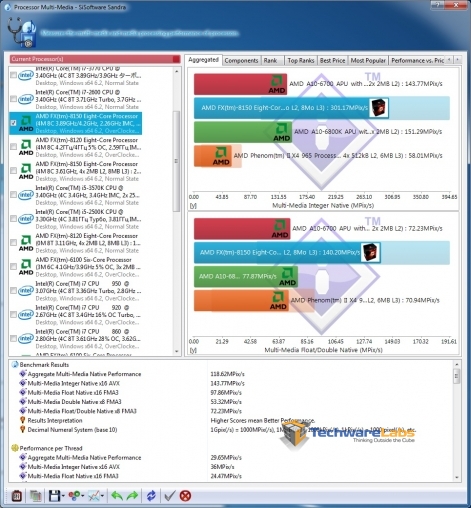 |
 |
| 6800k and 6700 | 5600k (stock and overclocked) |
In the multimedia benchmark the 6800k beats the 6700 by about 6% and the 5600k by 14-15%. Again even when overclocked the 5600k still gets beat by a few percent.
x264
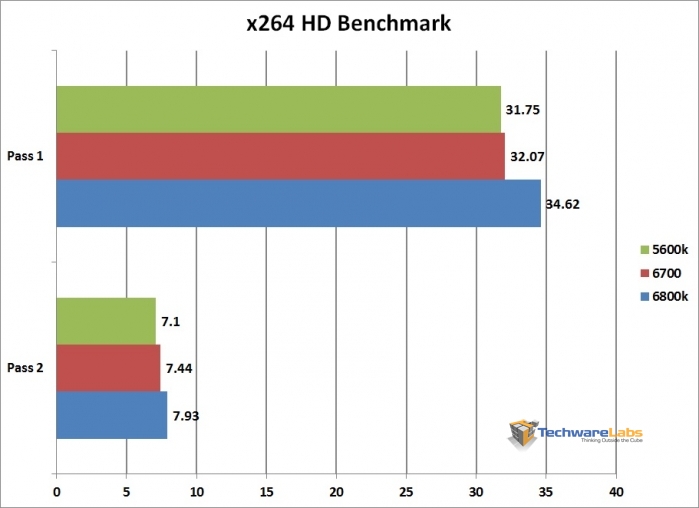 |
x264 is a benchmark that measures how fast your PC can encode 1080p video into the x264 format. On the first pass the 6800k and 6700 averaged 34.62 and 32.07 fps respectively. On the second pass they averaged 7.93 and 7.94 respectively. Overall we saw about a 6-7% increase from the 6700 to the 6800k. The 5600k was about 9% behind the 6800k.
|
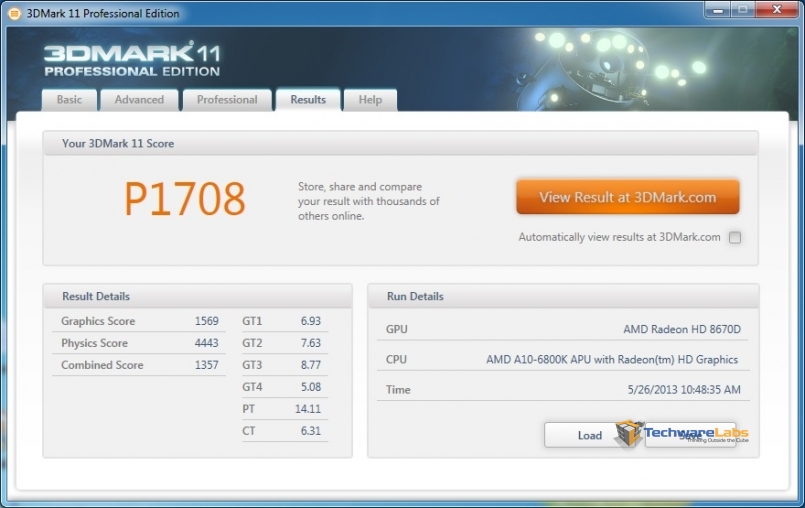
3DMark 11
 |
 |
 |
| 6800k | 6700 | 5600k |
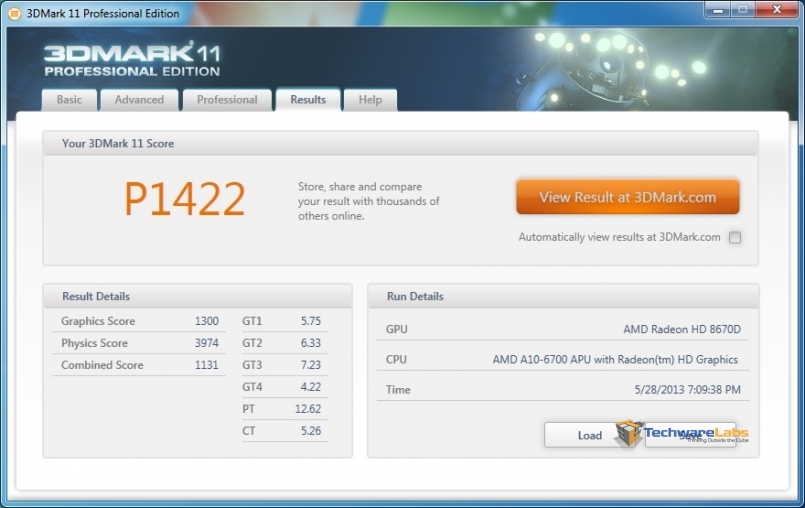
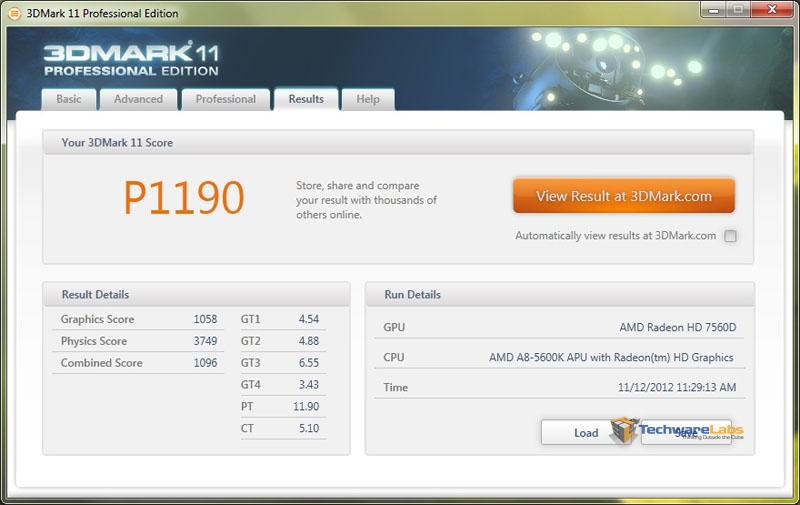
3DMark 11 tests a systems DirectX 11 performance. Our 6800k received a score of 1564 on the performance preset with the 6700 about 9% behind at 1422. The 6800k beat the previous gen 5600k by a whopping 24%.
The numbers pushed by the Richland chips are very impressive considering there is no discrete GPU.
3DMark
 |
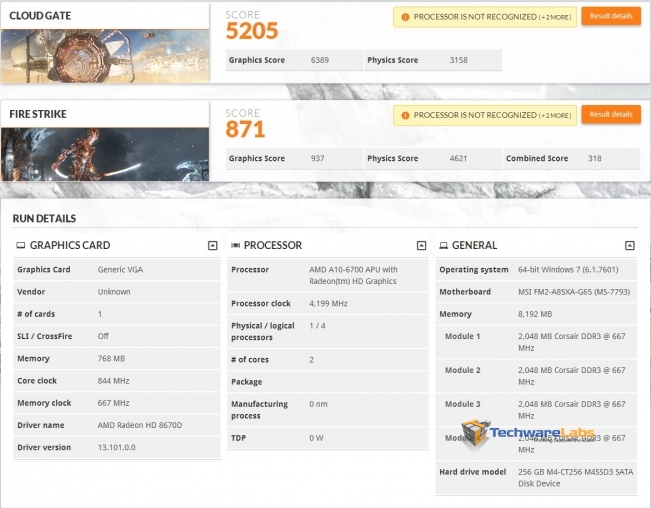 |
| 6800k | 6700 |
The new 3DMark benchmark is an all-in-one suite. It has a test for mobile devices (Ice Storm), home PCs (Cloud Gate), and gaming PCs (Fire Strike). I included the Cloud Gate and Fire Strike benches since this system falls right in between those two categories. In the Cloud Gate benchmark the 6800k scored 5859 and the 6700 scored a 5205, giving the 6800k an 11% advantage.
In Fire Strike the 6700 scored 871 points while the 6800k pulled off a 981, again an 11% improvement.
Passmark
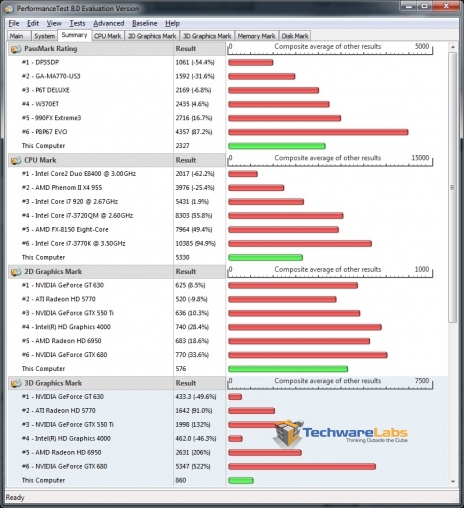 |
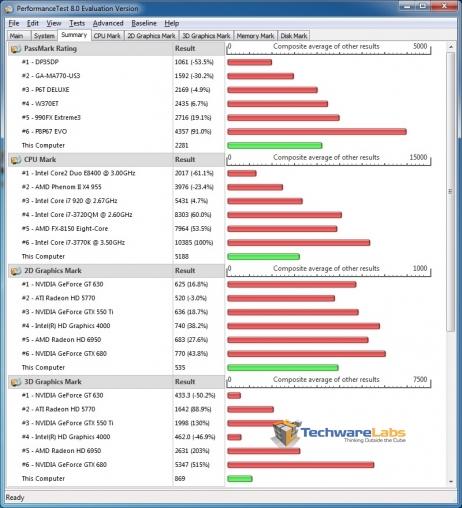 |
 |
| 6800k | 6700 | 5600k |
Passmark tests the system as a whole, CPU, 2D, 3D, etc. In the CPU section the 6800k scored a 5330 while the 6700 scored 5188. This minor change is due simply to the clock increase of the 6800k. The 5600k got beat by 14.6%.
In the 2D portion, the 6700 scored 535 and the 6800k 576, about a 7% increase. This again is caused mainly by the clock speed difference. The 5600k is down by about 13%.
The 3D benchmark relies on the GPU so logically the 6800k and 6700 scored about the same around 860. The 5600k only scored a 773.
Unigine Heaven
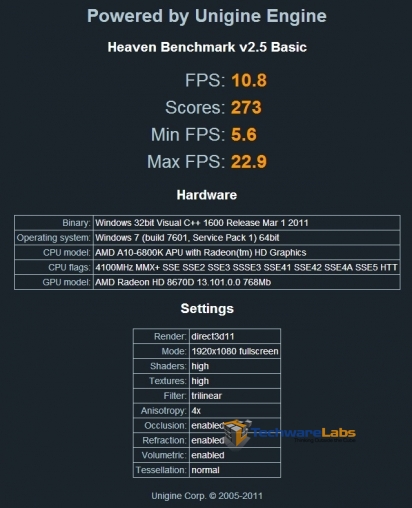 |
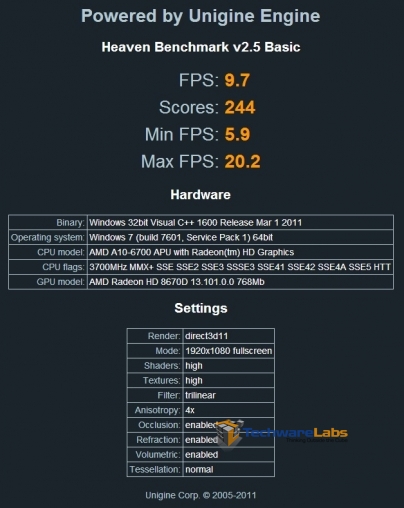 |
 |
| 6800k | 6700 | 5600k |
Unigine Heaven is a graphically intensive DirectX 11 benchmark that heavily stresses the GPU as well as the CPU. This benchmark is designed for high-end graphics cards so predictably the scores and FPS are quite low. The 6800k did on average about 10% better than the 6700 , scoring a 273 and averaging 10.8 FPS. Strangely the 6700 scored very close to the 5600k, only beating it by a few points.
|
DiRT 3
 |
 |
 |
| 6800k | 6700 | 5600k |
DiRT 3 represents a mid-level graphically intensive game. This benchmark was run at the medium preset with 0xAA at 1920×1080. Results are impressive considering there is no discrete GPU. Both the 6800k and 6700 averaged 36-37 FPS and never dropped below 30 FPS, meaning this game is completely playable even at 1080p. This game (and any game really) is obviously bottlenecked by the GPU which is why the two chips score the same. The 5600k is about 16% behind the new Richland chips.
Just Cause 2
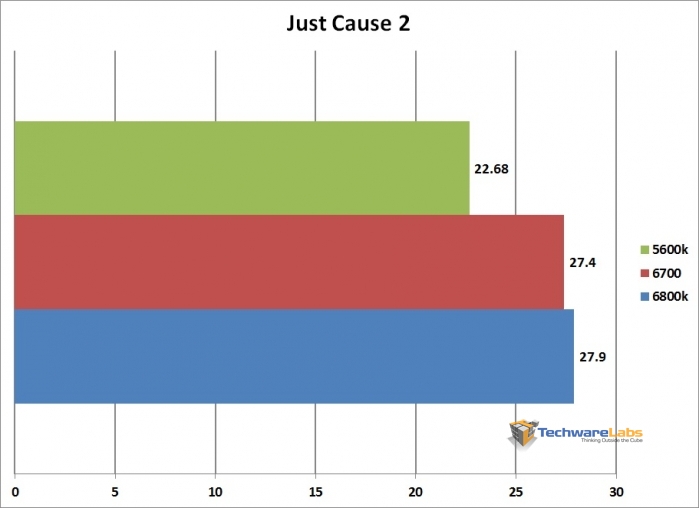 |
Just Cause 2 is an open world free roam game with a mid level hardware demand. With most settings maxed at 1920×1080 these chips were still able to average an impressive 27-28 FPS, a 19% improvement over the 5600k. With the resolution dropped a notch or some of the eye candy lowered, this game would be perfectly playable without a discrete GPU.
Aliens vs Predator
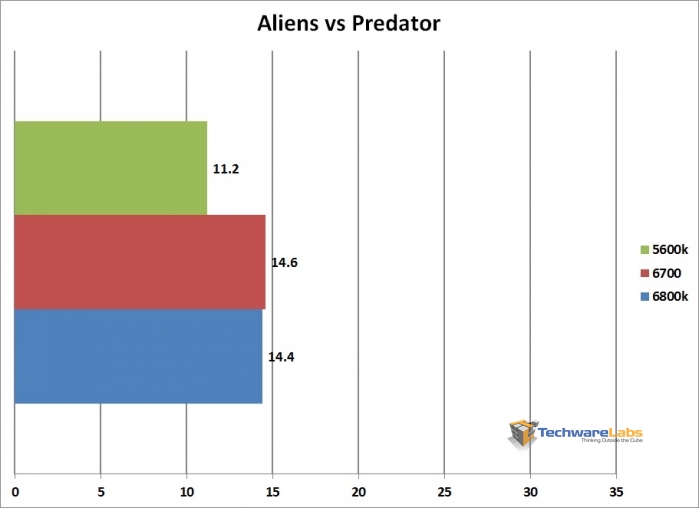 |
Aliens vs Predator tests DirectX 11 performance. This test was run with the default settings at 1920×1080. Both the 6800k and 6700 scored about 14.5 FPS versus the 5600k’s 11.2. Regardless of this increase settings would still need to be seriously lowered to play smooth in this title.
Dishonored
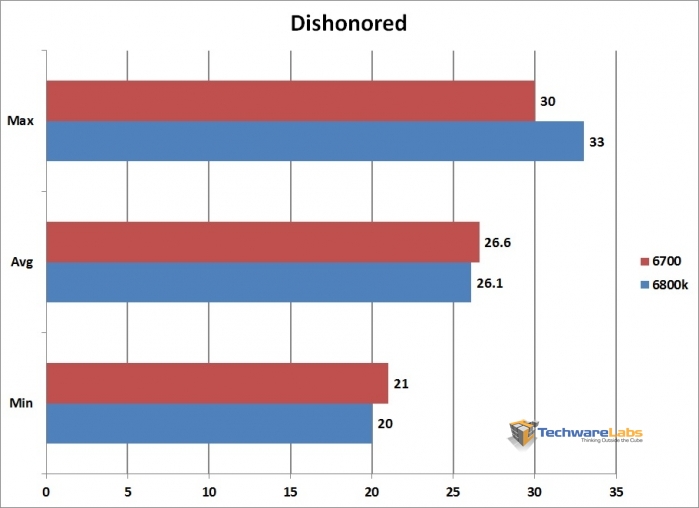 |
Dishonored is a mildly demanding title but our APUs were still able to average around 26 FPS with all settings on low at 1080p. A resolution drop would allow this game to be perfectly playable.
Far Cry 3
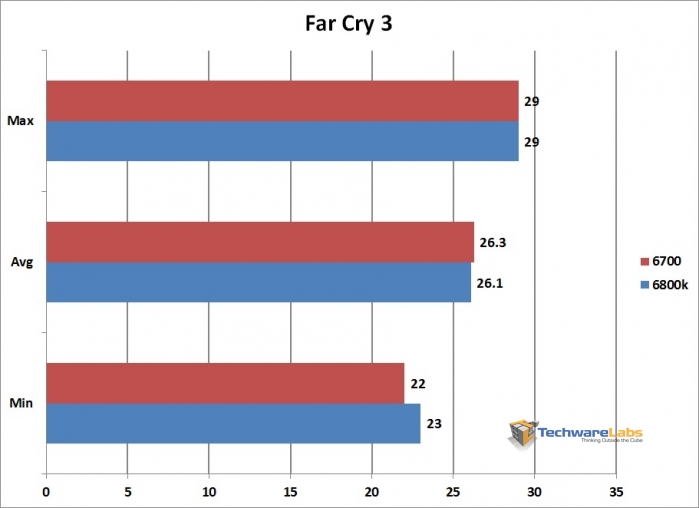 |
Far Cry 3 is a fairly demanding game with settings maxed but scales pretty well as the eye candy is reduced. At 1080p on the low preset our processors averaged 26 FPS. With a small resolution decrease this game could easily play smoothly.
|
Overclocking
 |
 |
The “k” in 6800k means that the chip has an unlocked multiplier. For the everyday user this doesn’t really matter but for an enthusiast you wouldn’t have it any other way. I decided to see how far I could push this new flagship APU while staying within a reasonable voltage range. With only a minor voltage jump I was able to bring the 6800k from 4.1 GHz to 4.5 GHz which is a pretty impressive number. The chip could have been pushed further but significantly more voltage was required and I felt that it just wasn’t worth it.
So with the CPU overclock taken care of I moved on to the GPU. These adjustments can be made to any of the APUs, not just the unlocked ones. I was able to increase the core clock from 844 MHz to 1013 MHz with no extra voltage which is quite impressive. AMD claims that 1000 MHz is common on stock cooling, so just imagine how far it could be pushed with a powerful cooler and lots of voltage. I decided to stop at 1013 MHz to show how an average, every-day overclock affects performance.
3DMark 11
|
 |
With the CPU at 4.5 GHz and the GPU over 1 GHz our 3DMark 11 score increased 144 points or 8.4% which isn’t bad for a mild overclock.
3DMark
|
 |
In the new 3DMark we saw a 70 point increase in Fire Strike and a 245 point increase in Cloud Gate, resulting in an average jump of about 5%.
Cinebench
 |
 |
Cinebench relies solely on the CPU so our 8.9% CPU OC resulted in a 7% score increase.
DiRT 3
|
 |
For DiRT 3 our overclock resulted only in a small 2 FPS jump in our average.
Far Cry 3
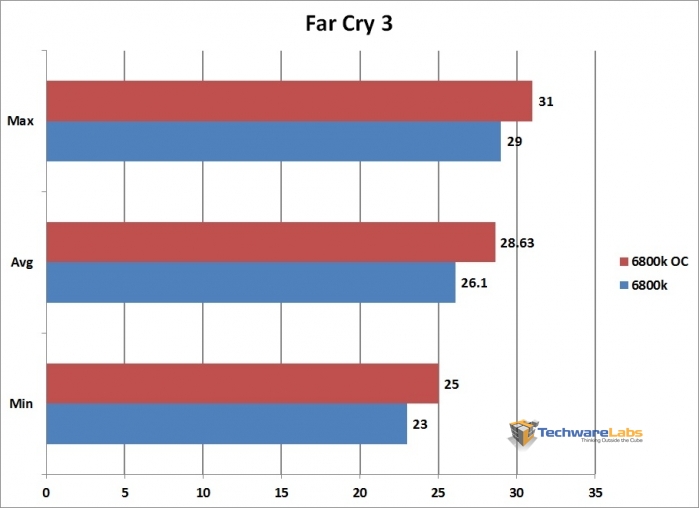 |
In Far Cry 3 we see another small FPS bump resulting in an overall increase of about 9%.
Temperature
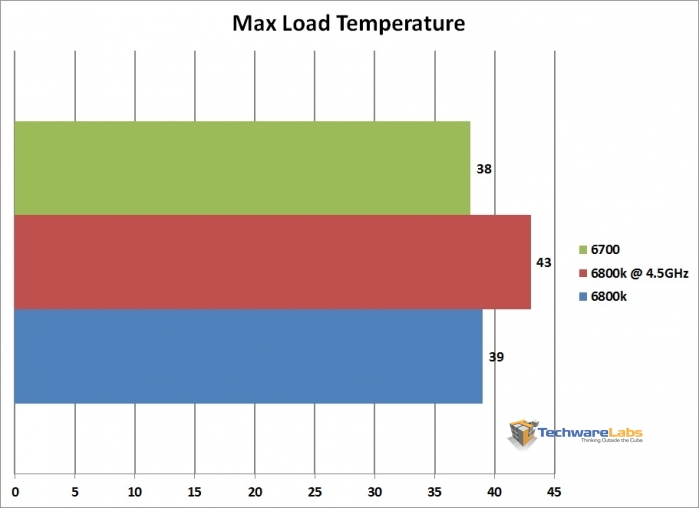 |
From the beginning the APUs have been pretty low power and therefore low heat. When you pair that with one of the best coolers on the market, the Corsair H100, what you get is absurdly low temperatures even under max stress. I pulled the temp readings after about 10 minutes of the Prime95 blend torture test.
The 6800k and 6700 were very close which makes sense seeing as their clocks and voltages are pretty close, with neither ever reaching even 40 degrees Celcius. But even with the 6800k overclocked to 4.5 GHz and extra voltage added, temps only jumped up a few degrees to 43. There is still plenty of overhead to pump some serious voltage into these chips if you have a powerful cooler.
–~~~~~~~~~~~~–
| |
Final Thoughts
Overall I am pretty impressed with the new Richland chips. They offer plenty of CPU power for anything your average user would throw at it, and even has enough GPU power to do some gaming. You can pair it with an affordable motherboard and you have a fairly capable system on your hands. The real benefits come from its expansion capabilities though. You can start off with just a chip, motherboard, and some cheap RAM, start overclocking to get some free performance, slap a dedicated GPU and faster RAM in, and suddenly you have a serious machine.
The bottom line is that these AMD APUs are affordable, capable, and expandable which is really everything you can ask for. You will never be able to get the performance of a high-end chip from them, but for someone who is on a budget and would like to get something decent now and build it up down the road, this really is the perfect solution. For what these chips were designed for, they do it well.
 |

[…] AMD Richland A10-6800K and A10-6700 APU Review @ TechwareLabs.com […]
[…] AMD Richland A10-6800K and A10-6700 APU Review @ TechwareLabs.com […]
[…] AMD Richland A10-6800K and A10-6700 APU Review @ TechwareLabs.com […]
[…] AMD Richland A10-6800K and A10-6700 APU Review @ TechwareLabs.com […]
[…] You can read more at Techware Labs. […]