

|
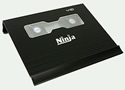


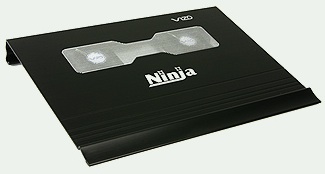
VIZO Ninja II Laptop Cooler
Thermal Testing Procedure and Results
The Ninja II laptop cooling pad review comes complete with Intel-provided analytics - the Thermal Analysis Tool is nominally available for any Intel Core chip, but tracking it down from a third party proved far less exasperating. The software was configured to measure the temperature of both cores (one sample per ten seconds) to see just how effective the Ninja really is. The testing procedure is pretty simple - see what happens to the mercury when the Ninja is running, and then turn it off and see how high it climbs. To produce an adequate load, a sufficiently processor-intensive task was chosen; namely Team Fortress 2 with 32-player servers. Hours of it.
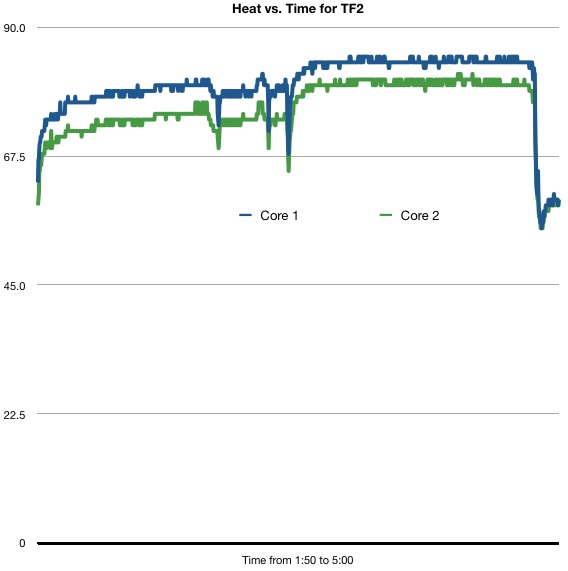
Peak temperatures of 85° celsius (Intel reports the magic smoke leaks out at 100° C on my T7700) were recorded from the whole outing, near the end of the second massive match; the two plateaus in the middle were short matches while searching for a good server. The data from these was discarded due to the short run; the core temperature had not yet stabilized when the matches ended. The first match was characterized by a quick ramp-up to 77° and then a long slow climb to 80° over the course of the match, peaking at the end of the game. Only six samples near the end of the first match - played with the Ninja pad running - indicate the peak temperature of 81° celsius; the first run consisted of a quick ramp-up to 77° and then a long slow climb to 80°. A local minimum occurred at 2:55 AM while browsing servers; core 1 plunged to 73° and core 2 finally broke into the sixties (again!) at 69°. The graph indicates this happened at the end of the first long match, with the end of the first practce match indicated by a local minimum at 3:14 of 69° also. The overall minimum during a break occurred at 3:21, when the primary core fell as low as 68° with core 2 at a downright chilly 65°. This match was started same as the first - but with one big difference. The switch on the Ninja was in the OFF position. Temperatures climb a bit more quickly without the Ninja keeping the case cooled (the fans on the Ninja and Macbook Pro are unfortunately very badly aligned, about as badly as possible) and come to a flatter plateau of about 84° with longer peaks of 85.
At the end of the test, the computer was dropped back to the desktop (and idle load) and the Ninja turned back on - at the time, I had no way of knowing just how hot the rest of the motherboard was running and I was uncomfortable about just how high it could go before I started cooking capacitors.
So all told, a difference in peak temperature of 4° celcius. Not altogether huge, but measurements are limited by Intel’s sensors and the placement thereof (they have a reputation for placing onboard sensors far away from the really hot parts of the chip); also whereas the N+ test had only six samples reporting the peak temperature, I stopped counting on the N- test at eighteen, telling me it was probably closer to 4.5 or 5 degrees difference at its absolute peak; I shudder to think what my poor GPU was running at. (Thank Jobs for AppleCare!)
Download the original testing data in CSV format here, if you’re so inclined.
REALTIME PRICING ON NOTEBOOK COOLERS