

|


Intel Q9650 3.00GHz Quad Core Processor
![]()
3DMark Vantage:

3DMark®Vantage is composed of four full-bore benchmarking tests (2 different CPU tests and 2 different GPU tests) and 6 feature tests. Four presets, a groundbreaking new feature, vastly augment the variety of PCs that can be tested with the product. Presets range from value through performance to high end cinematic rendering resolutions and features. By creating a new set of high end presets, 3DMark®Vantage is future proofed for the new multi-core CPU and Graphics Processing Unit products as well as supporting the Physics Processing Unit to expand the range of technology, testing and prevent the benchmark from being bottlenecked for its users.
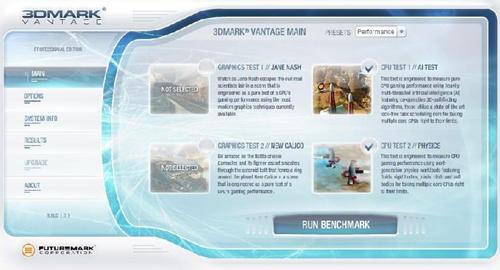
Since we weren't interested in the scores from our GTX280, we just ran the CPU tests. This is why we don't have a final 3DMark score.
Intel Q6700 @ 1066MHz |
 |
Intel Q6700 @ 1333MHz |
 |
Intel Q9650 @ 1333MHz |
 |
You'll notice that there is a HUGE difference between the Q6700 scores and the Q9650 scores. With roughly a ~25% increase in numbers, we also see that the plans per second have an increase between the processors - almost 300 more operations with the Q9650.
PCMark Vantage:
In addition to 3DMark Vantage, we decided to run PCMark Vantage. This is the largest test we run, and takes approximately 1 hour, 30 minutes to complete each run. It tests every facet of the processor, as well as the entire machine.
First, we look at the scores for gaming:
 |
 |
 |
Intel Q6700 @ 1066MHz |
Intel Q6700 @ 1333MHz |
Intel Q9650 @ 1333MHz |
We see there is a large improvement with the Intel Q9650 during the 1st gaming test. This improvement is also seen during the 3rd gaming test, as well as the 4th gaming test. The 2nd gaming test seems to rely mostly on the HDD, so we won't see too much of a difference. Note the large jump in the gaming score at the top left of each image.
 |
 |
 |
Intel Q6700 @ 1066MHz |
Intel Q6700 @ 1333MHz |
Intel Q9650 @ 1333MHz |
These are the results for the PCMark Vantage test. Just as usual, the results increase as we climb towards the Q9650. Every test seems to be a drastic improvement, and I'm happy to report this new rig getting 6700 PCMarks
REALTIME PRICING