

AOpen AX4C Max II
Review by Harry Lam
on 12.16.03
Motherboard provided by AOpen
Performance:
Setup:
Intel P4 3.2 GHz, 800MHz FSB, 512kB L2 Cache, HyperThreading Enabled CPU (Provided by Intel)
AOpen AX4C Max II Motherboard (Provided by AOpen)
AOpen AX4SG Max II Motherboard (Provided by AOpen)
Inno3D Tornado GeForce FX 5600 (Provided by
InnoVision)
2x 256 MB Corsair XMS PC3200 CAS2 DDR RAM
Maxtor DiamondMax Plus 9 80GB ATA/133 Hard Drive
Lite-On 16X DVD-ROM
Windows XP Professional Service Pack 1
Overclocking:
AOpen's Watchdog Timer technology made overclocking the AOpen AX4C Max II a breeze. The only time that we would actually have to pull the battery or use the reset jumper was when our memory couldn't handle the increased FSBs. We were able to get this board stable at 3.66GHz (229 x 16) with a 382MHz memory clock (which is a 14.5% CPU overclock and a 4.5% memory underclock). We were using a stock Intel heatsink and fan in our testing, which may attribute to the relatively low overclock. We did achieve an unstable overclock of 3.9GHz (244MHz FSB), but heat problems created instability of the CPU (the CPU was reaching external temperatures of over 140 degrees). The AX4C Max II has its FSB clock independent of AGP/PCI clock speeds, which allows for more flexibility and stability at higher frequencies.
Benchmark Numbers:
We tested this motherboard against the one of AOpen's Springdale-based motherboards, the AOpen AX4SG Max, as a reference point for the performance of this motherboard. All tests were repeated three times and the median score was chosen out of the three trial runs.
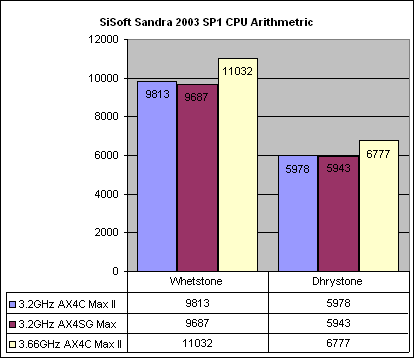
SiSoft Sandra 2003 SP1 CPU Arithmetic:
| Motherboard: | Whetstone Score: |
% Diff: | Dhrystone Score: |
% Diff: |
| 3.2GHz AX4C Max II | 9813 | 0% | 5978 | 0% |
| 3.2GHz AX4SG Max | 9687 | -1.3% | 5943 | -0.59% |
| 3.66GHz AX4C Max II | 11032 | 12.4% | 6777 | 13.4% |
There is a relatively insignificant performance gain between the AOpen AX4SG Max and the AX4C Max II in this synthetic CPU test. The 12.4% and 13.4% performance difference observed with the overclocked test scenario is relatively close to the theoretical 14.5% difference in CPU frequency.
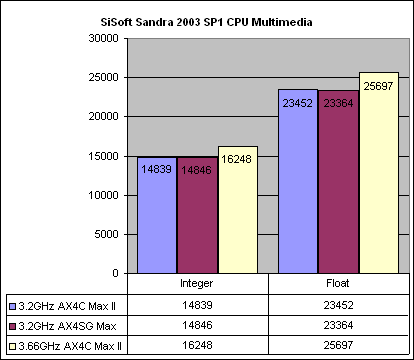
SiSoft Sandra 2003 SP1 CPU Multimedia:
| Motherboard: | Integer Score: |
% Diff: | Float Score: |
% Diff: |
| 3.2GHz AX4C Max II | 14839 | 0% | 23452 | 0% |
| 3.2GHz AX4SG Max | 14846 | 0.04% | 23364 | -0.37% |
| 3.66GHz AX4C Max II | 16248 | 9.5% | 25697 | 9.5% |
There is no performance difference in this test at all between the AX4C Max II and the AX4SG Max. We again should expect a 14.5% difference between the overclocked results and stock results, but only end up with a 9.5% difference.
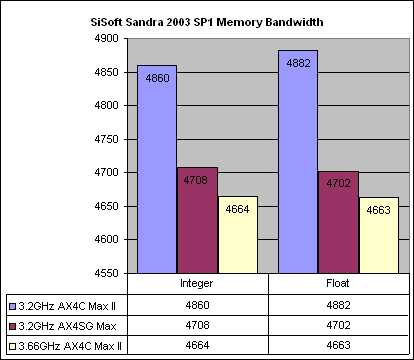
SiSoft Sandra 2003 SP1 Memory Bandwidth:
| Motherboard: | Integer Score: |
% Diff: | Float Score: |
% Diff: |
| 3.2GHz AX4C Max II | 4860 | 0% | 4882 | 0% |
| 3.2GHz AX4SG Max | 4708 | -3.1% | 4702 | -3.7% |
| 3.66GHz AX4C Max II | 4664 | -4.0% | 4663 | -4.5% |
This memory test shows a significant difference between AOpen's Springdale and Canterwood motherboards. The difference between the overclocked motherboard and the stock motherboard almost exactly matches the theoretical difference in memory speed (400MHz vs. 382MHz -- a difference of 4.5%).
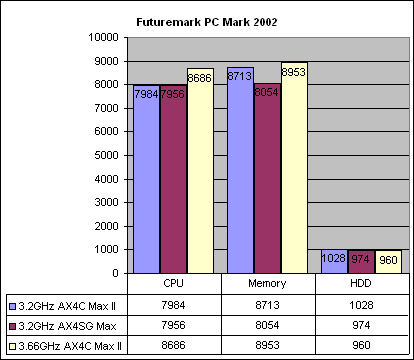
Futuremark PCMark 2002:
| Motherboard: | CPU Score: |
% Diff: | Memory Score: |
% Diff: | HDD Score: |
% Diff: |
| 3.2GHz AX4C Max II | 7984 | 0% | 4882 | 0% | 1028 | 0% |
| 3.2GHz AX4SG Max | 7956 | -0.35% | 4702 | -3.7% | 974 | -5.3% |
| 3.66GHz AX4C Max II | 8686 | 8.8% | 4663 | -4.5% | 960 | -6.6% |
The results of this synthetic benchmark basically mirrors the results shown earlier in Sandra, with an insignificant difference in CPU speed between the two motherboards, and a significant difference in memory speeds. The overclocked result set shows similar gains/losses in CPU/memory performance.
Multimedia Winstone Content Creation 2003:
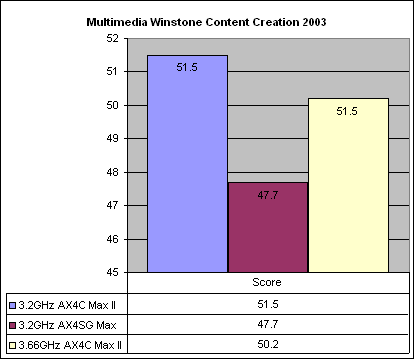
| Motherboard: | Score: | % Diff: |
| 3.2GHz AX4C Max II | 51.5 | 0% |
| 3.2GHz AX4SG Max | 47.7 | -7.4% |
| 3.66GHz AX4C Max II | 50.2 | -2.5% |
This is our first real-world test, which is a series of scripted actions in commonly-used multimedia applications (like Adobe Photoshop and Premiere). This test gives a gauge to the multimedia performance of our test setups. We can see that this test stresses the memory subsystem of a computer a slight bit more than the CPU subsystem, and rewards the stock 3.2GHz AX4C Max II with a slightly higher score than its overclocked counterpart. There is a significant difference between the AX4SG Max and the AX4C Max II in this test.
Business Winstone 2002:
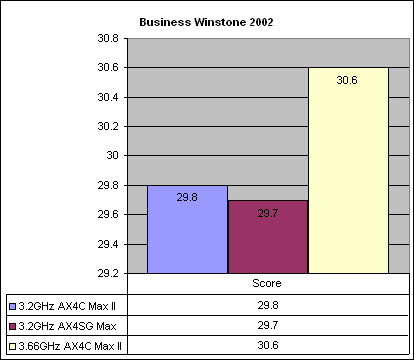
| Motherboard: | Score: | % Diff: |
| 3.2GHz AX4C Max II | 29.8 | 0% |
| 3.2GHz AX4SG Max | 29.7 | -0.34% |
| 3.66GHz AX4C Max II | 30.6 | 2.7% |
This real-world test incorporates actions from Microsoft Office as well as Norton Anti-Virus and WinZip. This test is designed to simulate the everyday usage of a business computer. In this test, CPU speed seems to be the most significant performance indicator. There is virtually no difference between the two motherboards on this test, and a relatively minimal performance increase for the overclocked machine (2.7% compared to a theoretical 14.5% increase in CPU speed).
Futuremark 3DMark 2003:
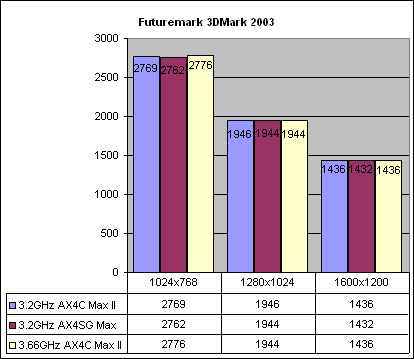
| Motherboard: | 1024x768: | % Diff: | 1280x1024: | % Diff: | 1600x1200: | % Diff: |
| 3.2GHz AX4C Max II | 2769 | 0% | 1946 | 0% | 1436 | 0% |
| 3.2GHz AX4SG Max | 2762 | -0.25% | 1944 | -0.1% | 1432 | -0.2% |
| 3.66GHz AX4C Max II | 2776 | 0.25% | 1944 | -0.1% | 1436 | 0% |
We start our gaming-related tests first with this synthetic benchmark. We can see that this test is extremely video card limited and motherboard selection/CPU speed has virtually no influence at all on test scores.
Futuremark 3DMark 2001 SE noAA:
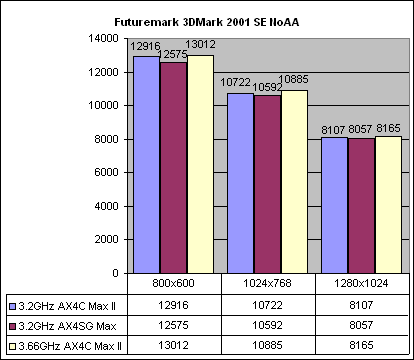
| Motherboard: | 1024x768: | % Diff: | 1280x1024: | % Diff: | 1600x1200: | % Diff: |
| 3.2GHz AX4C Max II | 12916 | 0% | 10722 | 0% | 8107 | 0% |
| 3.2GHz AX4SG Max | 12575 | -2.6% | 10592 | -1.21% | 8057 | -0.61% |
| 3.66GHz AX4C Max II | 13012 | 0.74% | 10885 | 1.5% | 8165 | 0.71% |
As expected, as resolutions increase the impact of the different motherboards decreases and the test becomes more and more video card limited. The influence of the overclocked CPU is relatively insignificant for this test.
Futuremark 3DMark 2001 SE 2xAA:
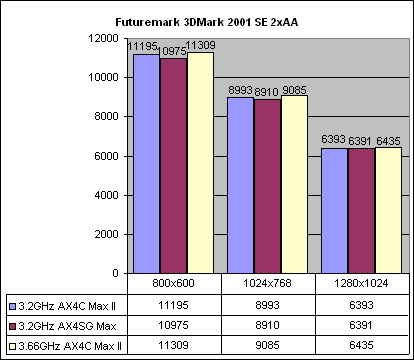
| Motherboard: | 1024x768: | % Diff: | 1280x1024: | % Diff: | 1600x1200: | % Diff: |
| 3.2GHz AX4C Max II | 11195 | 0% | 8993 | 0% | 6393 | 0% |
| 3.2GHz AX4SG Max | 10975 | -2.0% | 8910 | -0.92% | 6391 | -0.03% |
| 3.66GHz AX4C Max II | 11309 | 1.0% | 9085 | 1.0% | 6435 | .66% |
Futuremark 3DMark 2001 SE 4xAA:
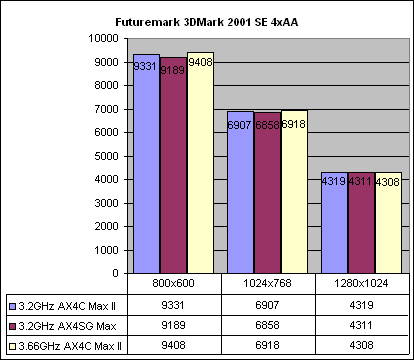
| Motherboard: | 1024x768: | % Diff: | 1280x1024: | % Diff: | 1600x1200: | % Diff: |
| 3.2GHz AX4C Max II | 9331 | 0% | 6907 | 0% | 4319 | 0% |
| 3.2GHz AX4SG Max | 9189 | -1.5% | 6858 | -0.71% | 4311 | -0.19% |
| 3.66GHz AX4C Max II | 9408 | 0.83% | 6918 | 0.15% | 4308 | -0.25% |
The two anti-aliasing tests gives us a general idea of the variance for this test. We don't see any significant nor consistent differences between any of the three test setups.
Novalogic Comanche 4:
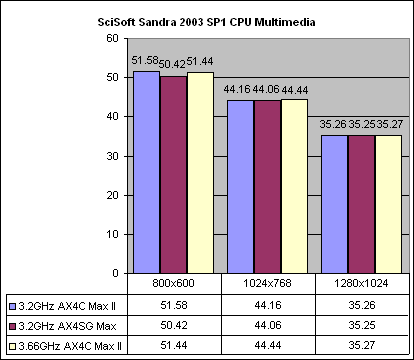
| Motherboard: | 800x600: | % Diff: | 1024x768: | % Diff: | 1280x1024: | % Diff: |
| 3.2GHz AX4C Max II | 51.58 | 0% | 44.16 | 0% | 35.26 | 0% |
| 3.2GHz AX4SG Max | 50.42 | -2.24% | 44.06 | -0.23% | 35.25 | -0.03% |
| 3.66GHz AX4C Max II | 51.44 | -0.27% | 44.44 | 0.63% | 35.27 | 0.03% |
This test results in no playable difference between any of the three setups, however there is a somewhat significant between the two motherboards at 800x600.
Unreal Tournament 2003 Flyby:
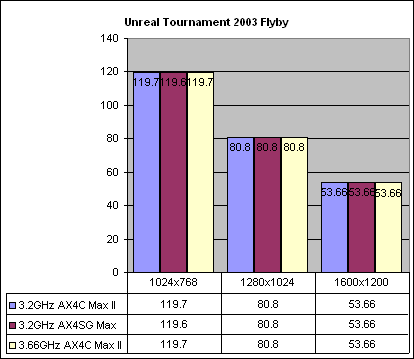
| Motherboard: | 1024x768: | % Diff: | 1280x1024: | % Diff: | 1600x1200: | % Diff: |
| 3.2GHz AX4C Max II | 119.7 | 0% | 80.8 | 0% | 53.66 | 0% |
| 3.2GHz AX4SG Max | 119.6 | -0.08% | 80.8 | 0% | 53.66 | 0% |
| 3.66GHz AX4C Max II | 119.7 | 0% | 80.8 | 0% | 53.66 | 0% |
This test primarily is a fill-rate based, video card performance test, which explains the entire lack of difference between the three test setups.
Unreal Tournament 2003 Botmatch:
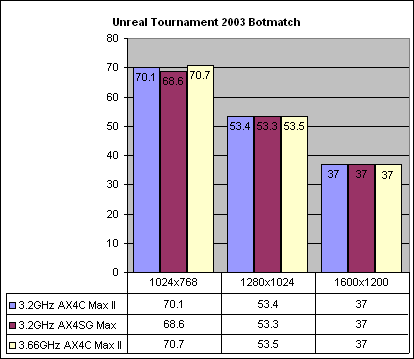
| Motherboard: | 1024x768: | % Diff: | 1280x1024: | % Diff: | 1600x1200: | % Diff: |
| 3.2GHz AX4C Max II | 70.1 | 0% | 44.16 | 0% | 35.26 | 0% |
| 3.2GHz AX4SG Max | 68.6 | -2.1% | 44.06 | -0.23% | 35.25 | -0.28% |
| 3.66GHz AX4C Max II | 70.7 | 0.86% | 44.44 | 0.63% | 35.27 | 0.28% |
We can see a tad bit more variation with the results in this test, with a notable 2.1% difference between the AX4SG Max and AX4C Max II at 1024x768.
| « BIOS/ Features | Conclusion » |