

Intel's New Family of 800 MHz FSB Processors
Review by Michael
Tran on 6.05.03
Managing Editor: Harry Lam
CPU Provided by Intel
Performance (Continued):
Unreal Tournament 2003 Flyby:
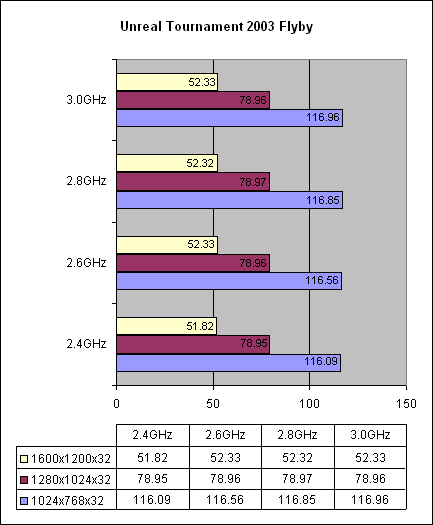
| Processor (1024x768x32) | FPS | Theoretical % | Actual % |
| 2.4GHz 800MHz FSB | 116.09 | 0.0% | - |
| 2.6GHz 800MHz FSB | 116.56 | 8.3% | 0.4% |
| 2.8GHz 800MHz FSB | 116.85 | 16.7% | 0.7% |
| 3.0GHz 800MHz FSB | 116.96 | 25.0% | 0.7% |
The increase from 2.4GHz to 3.0GHz increase was 0.7% (and .87 frames per second), resulting in basically no significant increase at all from increasing CPU speeds. This test is only a flyby, meaning that the CPU interaction is relatively minimal and fill rate is the emphasized issue. From the results we can conclude that this is video card limited, with a very minimal CPU impact of 3%-5%.
| Processor (1280x1024x32) | FPS | Theoretical % | Actual % |
| 2.4GHz 800MHz FSB | 78.95 | 0.0% | - |
| 2.6GHz 800MHz FSB | 78.96 | 8.3% | 0.01% |
| 2.8GHz 800MHz FSB | 78.97 | 16.7% | 0.03% |
| 3.0GHz 800MHz FSB | 78.96 | 25.0% | 0.01% |
The differences between the four processors were even more insignificant than the other tests. Since there is no difference between any of the scores, this test is obviously video card limited. At 78.97 FPS, this game is very playable at this resolution but enabling additional features might drop the frame rates significantly below 60 FPS. There was less than 1% CPU impact during these benchmarks.
| Processor (1600x1200x32) | FPS | Theoretical % | Actual % |
| 2.4GHz 800MHz FSB | 51.82 | 0.0% | - |
| 2.6GHz 800MHz FSB | 52.33 | 8.3% | 1.0% |
| 2.8GHz 800MHz FSB | 52.32 | 16.7% | 1.0% |
| 3.0GHz 800MHz FSB | 52.33 | 25.0% | 1.0% |
Notice that there is an improvement of 0.51 frames per second (which is insignificant) between 2.4GHz and 2.6GHz, but after that there are no more improvements of FPS when increasing to faster processor speeds. This again is clearly video card limited. The game is marginally playable at this resolution and the CPU impact ranged from 4%-12%.
Unreal Tournament 2003 Botmatch:
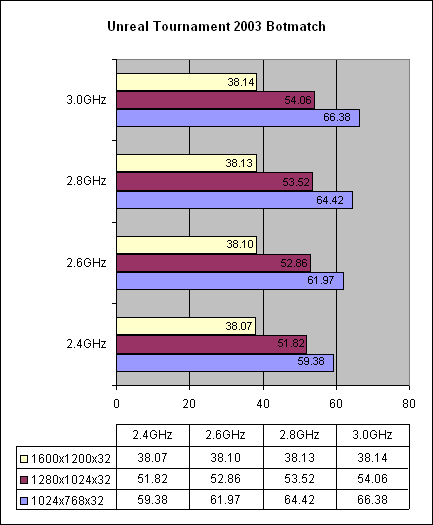
| Processor (1024x768x32) | FPS | Theoretical % | Actual % |
| 2.4GHz 800MHz FSB | 59.38 | 0.0% | - |
| 2.6GHz 800MHz FSB | 61.97 | 8.3% | 4.4% |
| 2.8GHz 800MHz FSB | 64.42 | 16.7% | 8.5% |
| 3.0GHz 800MHz FSB | 66.38 | 25.0% | 11.8% |
The test is CPU limited since there is a visible linear slope. For every 200 MHz, there is a 3%-5% increase. There are 7 frames per second between 2.4 GHz and 3.0GHz (which doesn't sound like much, but at these speeds the differences are quite significant). The botmatch test gives a more realistic gauge to an in-game situation. Understandably, the frame rates are lower on this test and the improvements between CPU speeds are quite visible. This test had a 47-53% CPU impact and is playable at this resolution.
| Processor (1280x1024x32) | FPS | Theoretical % | Actual % |
| 2.4GHz 800MHz FSB | 51.82 | 0.0% | - |
| 2.6GHz 800MHz FSB | 52.86 | 8.3% | 2.0% |
| 2.8GHz 800MHz FSB | 53.52 | 16.7% | 3.3% |
| 3.0GHz 800MHz FSB | 54.06 | 25.0% | 4.3% |
Again this test is somewhat CPU limited which an average slope of 1.4% per processor increase. The difference between 2.4GHz and 3.0GHz becomes much smaller than before. As the resolution is increased, the video card becomes more and more the limiting factor. This is shown by the decrease of CPU impact, which dropped to about 17-24%. The game is still marginally playable at this resolution, depending on the specific level and number of extra players/bots.
| Processor (1600x1200x32) | FPS | Theoretical % | Actual % |
| 2.4GHz 800MHz FSB | 38.07 | 0.0% | - |
| 2.6GHz 800MHz FSB | 38.10 | 8.3% | 0.08% |
| 2.8GHz 800MHz FSB | 38.13 | 16.7% | 0.2% |
| 3.0GHz 800MHz FSB | 38.14 | 25.0% | 0.2% |
As we increased to the final resolution, the test switched from CPU limited to video card limited. Notice that there is only a 0.07 frames per second difference between 2.4GHz and 3.0GHz. The CPU impact dropped below 1% and the differences between the frame rates are non-existent.
Benchmark Conclusion:
Due to the fact that the Intel P4 3.00GHz 800MHz FSB is one of the top performing processors, the overall goal is to have all of the graphical tests limited by the video card rather than the CPU. As the results show, the video card is clearly the limiting factor in most of our tests, with the "standard" resolution of 1024x768x32 creating some very respectable results. This comes to show that the development and progression of processors are outweighing the development of video cards. However, as technology continually improves, the latest software and games will be there to challenge our hardware and raise the bar on an "average" system.
| « Previous Page | Next Page » |