

|


Thermaltake Vi-On HDD Enclosure
![]()
Testing:
The test system being used for testing the Thermaltake Vi-On is the following:
Motherboard: |
Asus M3N-HT Deluxe |
Processor: |
AMD Phenom 9950 |
Graphics: |
Palit GTX280 |
Ram: |
4GB Kingston HyperX DDR2-1066 |
Hard Drive: |
2x 150GB WD Raptors (Raid 0) |
Optical Drive: |
LiteOn DH-4B1S-08 Blu-ray Burner |
Power Supply Unit: |
Antec TruePower Quattro 850 Watt |
Operating System: |
Microsoft Windows Vista x64 Ultimate |
External Hard Drive |
80GB Western Digital Hard Drive |
For testing of the Thermaltake Vi-on Hard Drive Enclosure, we are going to run a series of disk speed tests on an 80GB WD Drive (information shown below) using it as an internal drive and using the externals USB and eSata interfaces. We will be using the Asus M3N-HT Deluxe Mempipe motherboard which sports he eSata availability as well as USB 2.0 ports. The series of tests what we will be running will find the average read and write speeds and the amount of time it takes for a random access. To find these we will be using Crystal Disk Mark, SiSoftware Sandra, HD Tune Pro, and Datamarck.

Crystal Disk Mark:
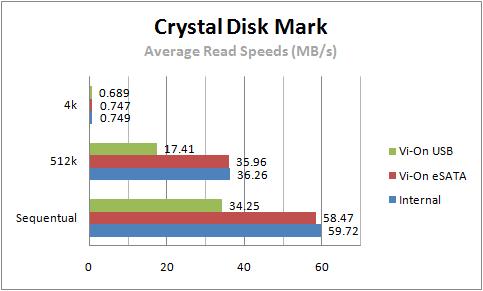
Crystal Disk Mark shows us the average read and write speeds of the drive. It runs three tests, a Sequential, 512k, and 4k test to find out its true speeds. For the end user, you will mainly be doing the sequential read and writes, so those are the results that we are mainly interested in. Below you will notice two graphs, one for average read speeds and the other for average write speeds, and just below those are three screen shots taken of the actual program itself.
 |
||
 |
||
 |
 |
 |
Vi-on USB |
Vi-on eSata |
Internal |
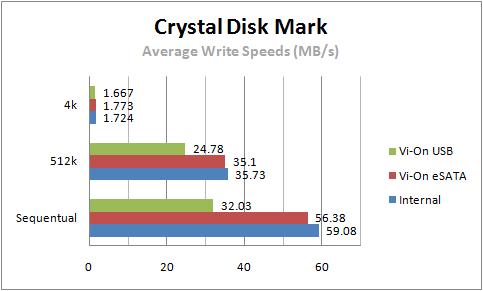
As you can see, using the drive as an internal drive we get an average read speed of 59.72 MB/s while attached in the eSata we get 58.47 MB/s. This 1.3MB/s difference is unnoticeable unless transferring massive amounts of data, which then there will only be a small time difference. When attached via USB, the speeds drop down to 34.25 MB/s which is standard for most USB external Devices. We ran into the same results when looking at the average write speeds, as the eSata speeds are slightly lower than the internal configuration.
SiSoftware Sandra 2009:
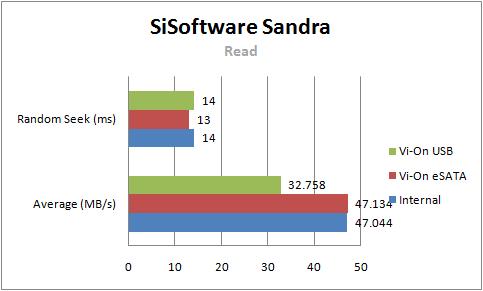
SiSoftware Sandra is a benchmark utility that will benchmark nearly every component in your system. Included in the plethora of benchmarks offered, is one that checks the average read and write speeds and the time it takes for a random seek.
 |
||
 |
 |
 |
Vi-on USB |
Vi-on eSata |
Internal |
As you can see on the above tests, SiSoftware Sandra showed that the drive achieved nearly identical speeds for reading, with eSata getting a slightly better result by 0.1 MB/s. The random seek time also showed a slight improvement in the eSata as it received 13ms, whereas the drive in the internal configuration received 14ms. This slight speed difference will be completely unnoticeable, but it is nice to know that the drive using the eSata is the exact same as the internal drives speed.
 |
||
 |
 |
 |
Vi-on USB |
Vi-on eSata |
Internal |
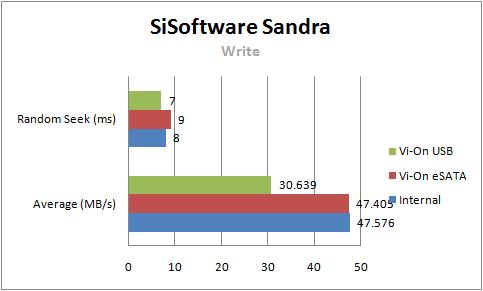
Shown above are the results for the write portion of SiSoftware Sandra's Benchmark, you will see that again the speeds for eSata and Internal are nearly identical. Showing only a 0.17 MB/s difference on the average write speeds, and a 1ms difference on the random seek.