|
DDR3 Week Round-Up
Performance Test 6.1:
Operations:
Higher numbers are better.
| Model: | Operations 1375 |
Operations 1600 |
Operations 1800 |
Kingston 1375 |
582.2 |
0 |
0 |
Corsair 1600 |
893.9 |
827.9 |
0 |
Kingston 1600 |
567.9 |
581.7 |
0 |
PQI 1600 |
888.2 |
882.8 |
0 |
Super Talent 1800 |
572.3 |
570.4 |
585.3 |
Patriot 1800 |
761.5 |
774.5 |
0 |
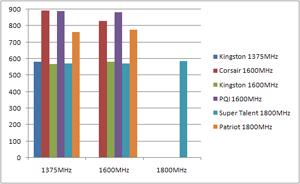
As you can see, the Corsair RAM and the PQI RAM seemed to dominate the top spot in numbers for the 1375 test. Once we shifted our attention to the 1600 test, Corsairs numbers seemed to drop off a bit, while PQI's numbers stayed strong. Remember that our PQI RAM is running at 1550MHz instead of the 1600MHz as well.
Memory Mark:
Higher numbers are better.
| Model: | Memory
Mark 1375 |
Memory
Mark 1600 |
Memory
Mark 1800 |
Kingston 1375 |
653.9 |
0 |
0 |
Corsair 1600 |
672.3 |
667.7 |
0 |
Kingston 1600 |
652.6 |
655.7 |
0 |
PQI 1600 |
668.5 |
669.4 |
0 |
Super Talent 1800 |
651.4 |
651.8 |
653.4 |
Patriot 1800 |
661.7 |
666.6 |
0 |
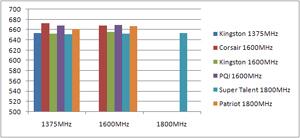
As we can see in this picture, the Corsair is #1 in the 1375 test, followed by the PQI in 2nd and the Patriot kit in 3rd. As we shift to the 1600 test, the graph levels out more, giving PQI the slight edge over the other two sets. Remember that our PQI RAM is running at 1550MHz instead of the 1600MHz as well.
PassMark:
Higher numbers are better.
| Model: | PassMark 1375 |
PassMark 1600 |
PassMark 1800 |
Kingston 1375 |
117.7 |
0 |
0 |
Corsair 1600 |
121.0 |
120.2 |
0 |
Kingston 1600 |
117.5 |
118.0 |
0 |
PQI 1600 |
120.3 |
120.5 |
0 |
Super Talent 1800 |
117.3 |
117.3 |
117.6 |
Patriot 1800 |
119.1 |
120.0 |
0 |
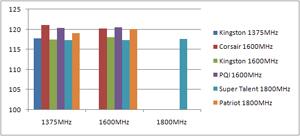
Our results from this test are the same as the test above. We see that Corsair is #1 in the 1375 test, followed by the PQI in 2nd and the Patriot kit in 3rd. As we shift to the 1600 test, the graph levels out more, giving PQI the slight edge over the other two sets. Remember that our PQI RAM is running at 1550MHz instead of the 1600MHz.
Real Time Pricing:


