CPU Benchmarks
The Intel® Core™ i7-3800 Desktop Processor series is the middle man choice with just enough enhancements to utilize some of the new goodies afforded by the new LGA2011 platforms including the X79 chipset base motherboard we have for our tests today. We rounded up our trusty collection of benchmark software that will stress the Intel® Core™ i7-3820 Processor and give us some data which will will interpret into useful comparable information. Keep in mind the results provided individual benchmark software are synthetic and are only able to assess the relative performance of the given system. The results of each test should be considered a reasonable evaluation of performance, and are better used to compare the performance of different systems. The numbers produced by benchmarking do not prove the efficiency, speed, and power of the processor being tested; it is much more useful and preferred to compare the results from this processor to another make/model of processor to show the differences in efficiency, speed, and power.
The best benchmark suites provide baseline data and comparison data to allow us to present you with actual information instead of just numbers. Keep in mind that in some of the following tests lower numbers are better (for example latency, time to complete an operation, etc) and in some test higher numbers are better (MB/s, scores, GFLOPS, etc). But have no fear, we will guide you through the results and point out anomalies and interesting results. Todays testing will include the following benchmarking software: AIDA64 v1.50.1230, PCMark Vantage x64, PerformanceTest v7.0, and SiSoftware Sandra 2012.
The Intel® Core™ i7-3820 is a partially locked processor meaning we are limited to a range of multipliers and a maximum of four speed bins over stock (up to 4.3GHz) when overclocking. Combined with the adjustable base clock up to 125MHz we can still get a decent overclock from the i7-3820. With the ASRock X79 Extreme9 motherboard we will overclock our i7-3820 CPU as high as possible even with these limitations. First all benchmarks will be run with the multiplier set to the default x36 which means the CPU will run at stock 3.6 Ghz (up to 3.9 Ghz turbo). This will be considered the baseline for later comparisons to over-clocked benchmarks.
Benchmarks – Stock 3.60 Ghz
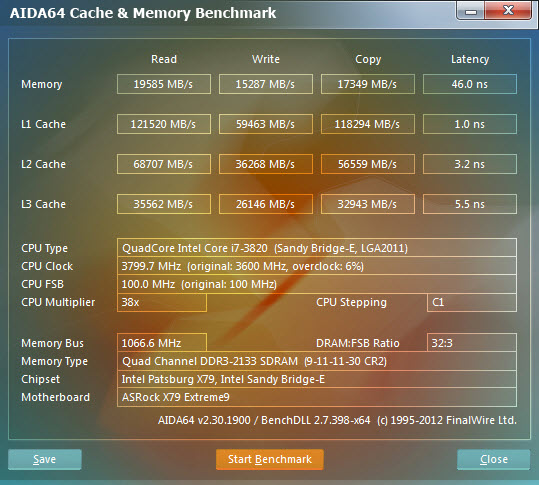
AIDA64 Extreme v2.30.1900
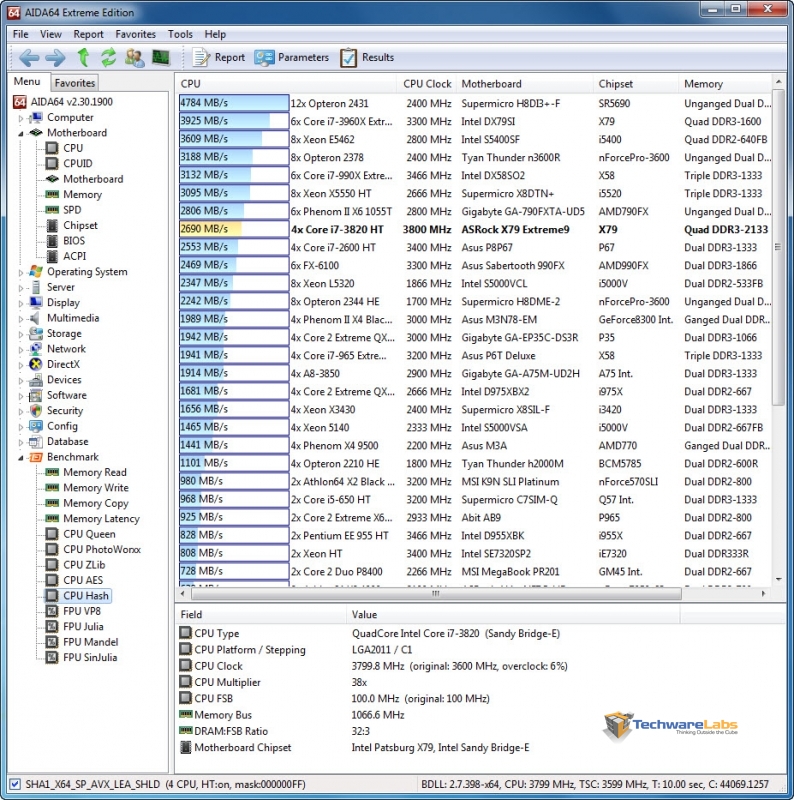
AIDA64 Extreme Edition is a streamlined Windows diagnostic and benchmarking software which provides a wide range of features to assist in overclocking, hardware error diagnosis, stress testing, and sensor monitoring. It has unique capabilities to assess the performance of the processor, system memory, and disk drives. For our purposes today, AIDA64 is able to test the limits of the CPU with a collection of tasks such as AES data encryption and gives us performance based on numbers. These numbers allow us to compare the Intel® 2nd Gen Core i7-3820 to other processors available on the market. The 5 CPU tests provided in AIDA64 are Queen, PhotoWorxx, ZLib, AES, and Hash.
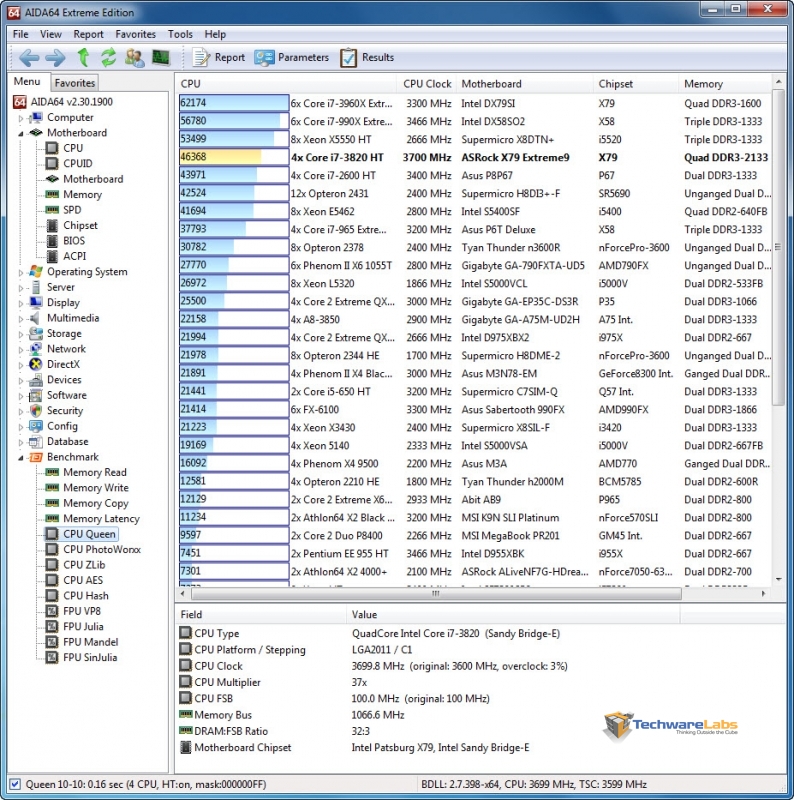
CPU Queen focuses on a chess related problem, solutions for the classic “Queens problem” on a 10 by 10 chessboard (more info here), using integer MMX, SSE2 and SSSE3 optimizations and focuses on the branch prediction capabilities and the misprediction penalties of the CPU. A CPU with the shorter pipeline and smaller amount of mispredictions will score higher. Basically this test is a number crunching math problem for the CPU.
CPU PhotoWorxx performs the following tasks on a very large RGB image: fill, flip, rotate left, rotate right, random color fill, color to b&w, difference, and crop. These are common tasks used during digital photo processing. This benchmark stresses the integer arithmetic and multiplication execution units of the CPU and also the memory subsystem.
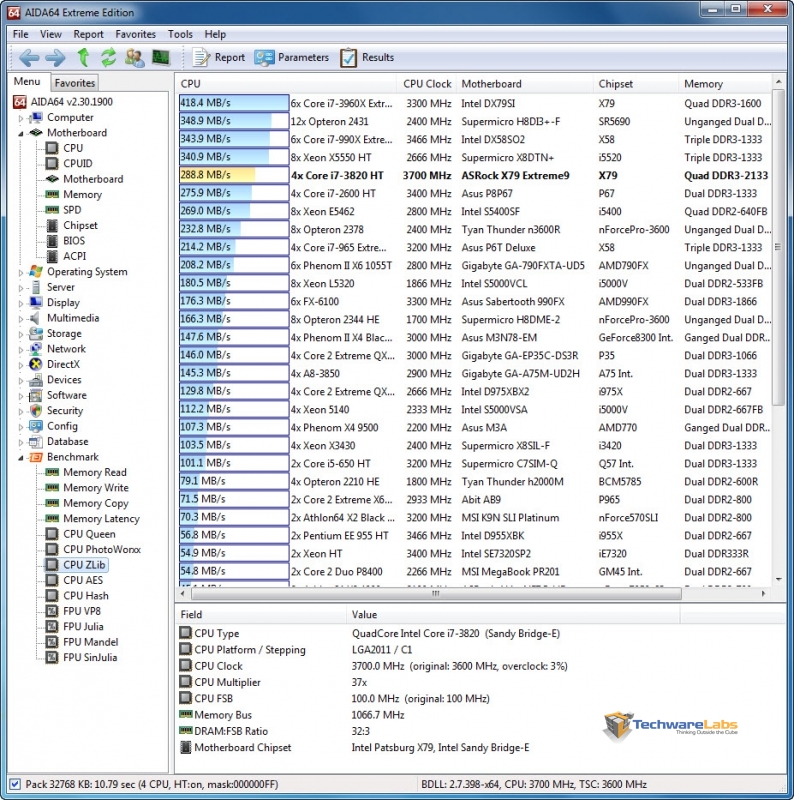
CPU ZLib is an integer benchmark which measures combined CPU and memory subsystem performance through the public ZLib compression library, a software library used for data compression.
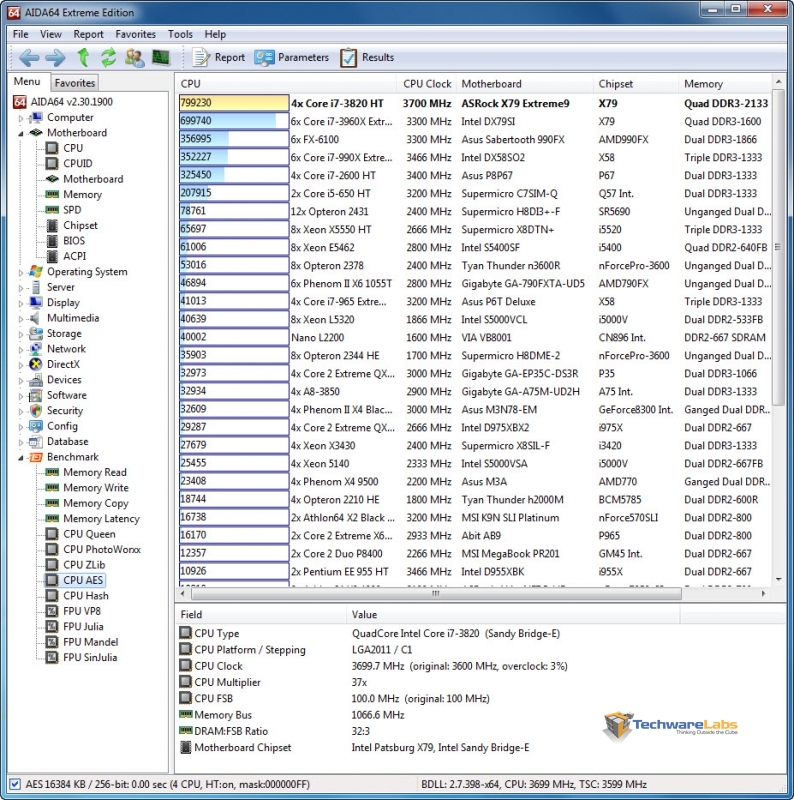
CPU AES is an integer benchmark measuring CPU performance using AES (Rijndael) data encryption. The 2600K should perform extremely well in this test due to hardware support and the New AES instruction set available in the Intel Core processors family.
CPU Hash is another integer benchmark measuring CPU performance using the SHA1 hashing algorithm. The code behind this benchmark method is written in Assembly, and it is optimized for every popular AMD, Intel and VIA processor core variants by utilizing the appropriate MMX, MMX+/SSE, SSE2, SSSE3, or AVX instruction set extension. In this benchmark every thread is working on independent 8 KB data blocks, and the MMX, SSE2 and SSSE3 optimized calculation routines implement the latest vectorization idea of Intel.
 |
 |
| CPU Queen – 4th | CPU PhotoWorxx – 2nd |
 |
 |
| CPU ZLib – 5th |
CPU AES – 1st |
 |
|
| CPU Hash – 8th |
|
Results all round proving the 2nd Gen Core i7-3820 CPU is up to the tasks we set before it. It would be interesting to see how close the 3820 scores in comparison to the 3960X and 3930K…
PCMark Vantage x64
This benchmark is a series of tests requiring the CPU, memory sub system, caches, GPU and more.
A PCMark score is a measure of your computer’s performance across a variety of common tasks such as viewing and editing photos, video, music and other media, gaming, communications, productivity and security. From desktops and laptops to workstations and gaming rigs, by comparing your PCMark Vantage score with other similar systems you can find the hardware and software bottlenecks that stop you getting more from your PC.
 |
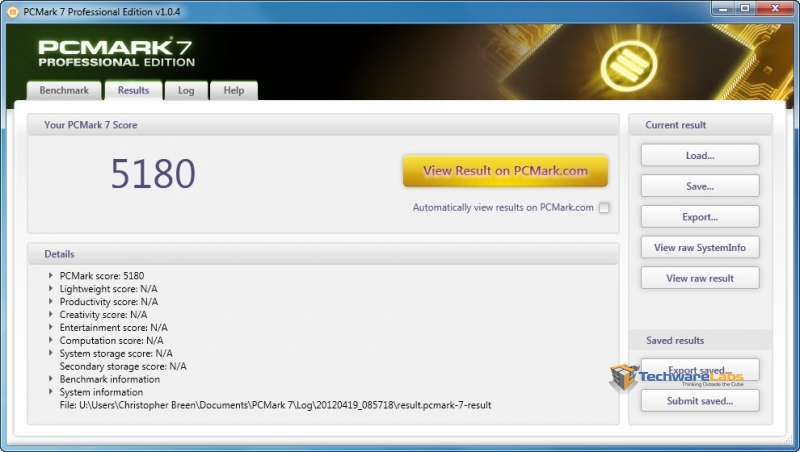 |
| How the test was setup to run | Results – PCMark 5180 |
Another successful PASS for the i7-3820. The results of PCMark Vantage are incredibly useful when comparing systems and also comparing over-clocking performance increase as we will see later on…
PerformanceTest v7.0
Another performance benchmark suite in our arsenal is PerformanceTest from PassMark. PassMark PerformanceTest allows you to objectively benchmark a PC using a variety of different speed tests and compare the results to other computers. We will use this suite to show the performance of the i7-3820. This benchmark will also provide a clear indication of performance increases gained from overclocking later in this article.
 |
 |
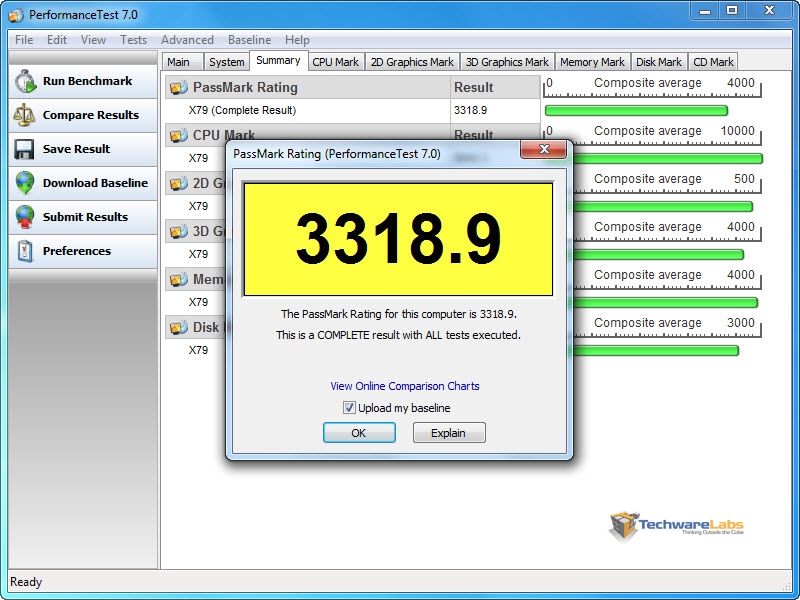
| PassMark Rating – 3318.9 vs 2635.9 [i7-2600K stock] |
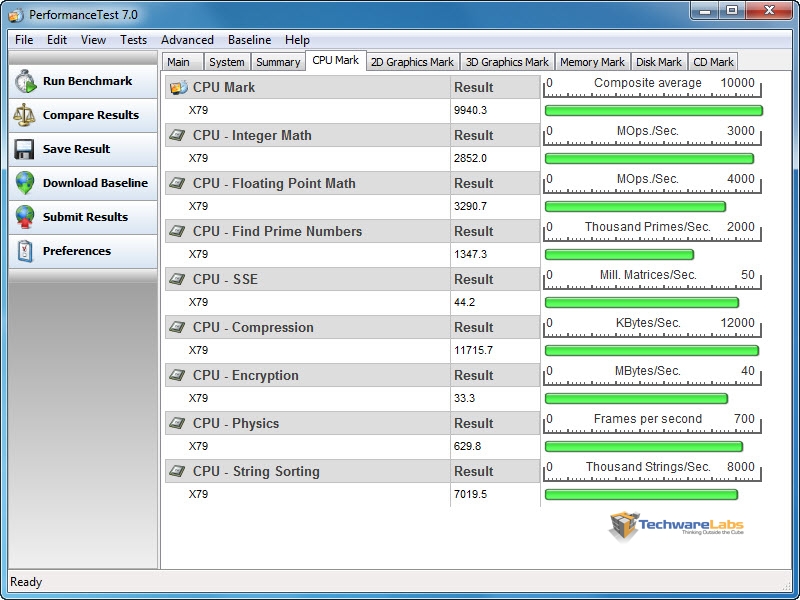
CPU Rating – 9940.3 vs 7102 [i7-2600K stock] |
The 2nd Gen Core i7 3820 is more than capable and it shows. Scores provided for the i7-2600K are a rudimentary comparison. Due to differences in the chipset architecture, memory channel support, and system components in general we cannot perform a direct numbers comparison. Basically we can conclude that the stock i7-3820 did score higher than the i7-2600K.
SiSoftware Sandra 2012
The Sandra suite gives us a more detailed look at the processor performance in particular areas of interest. There are 5 processor benchmarks of interest for our purposes today.
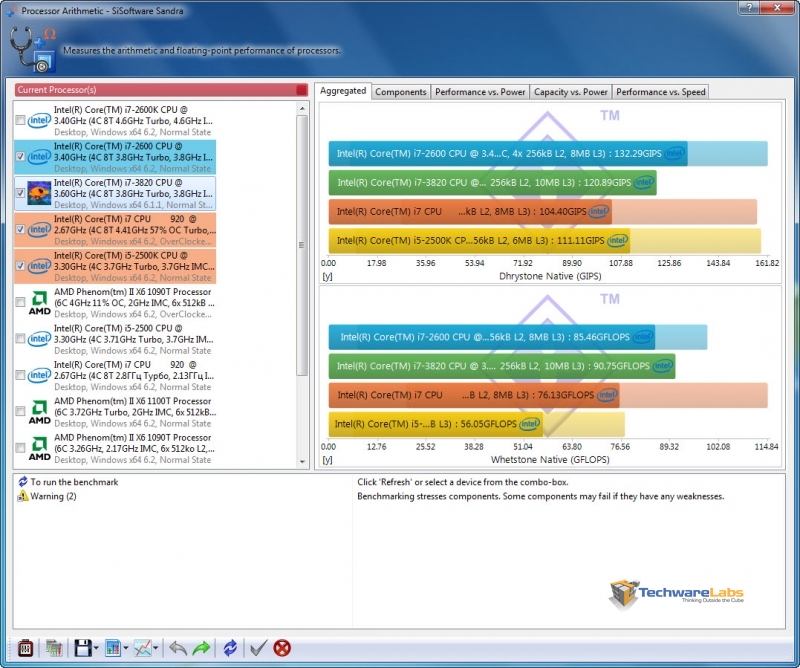
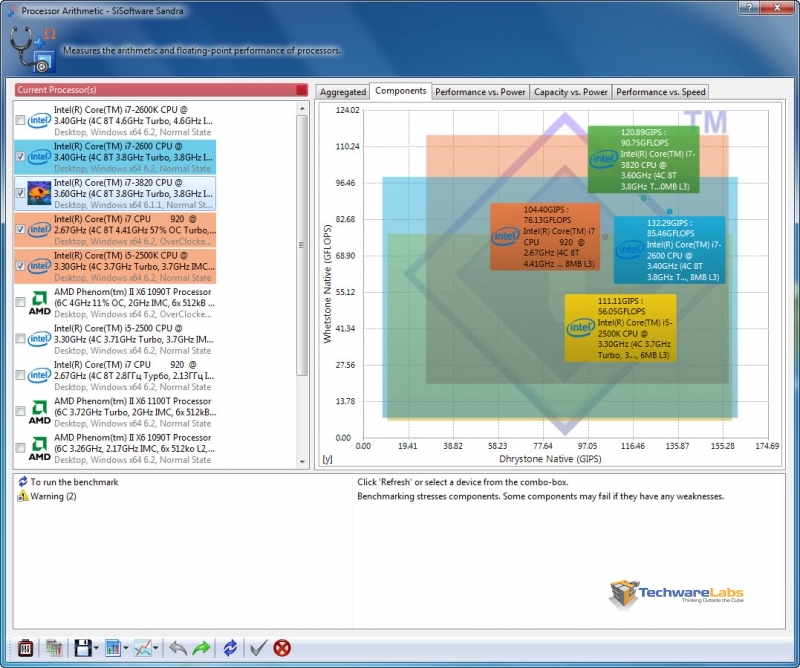
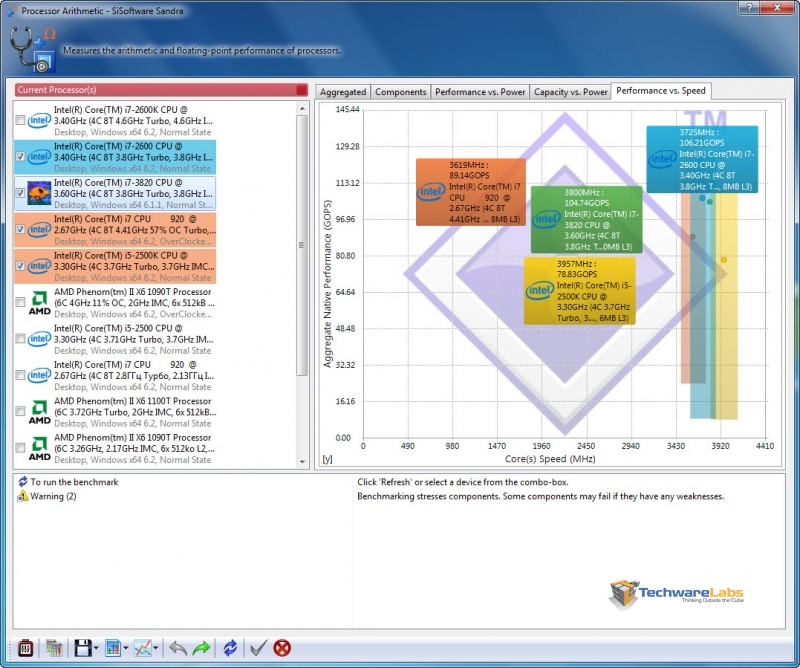
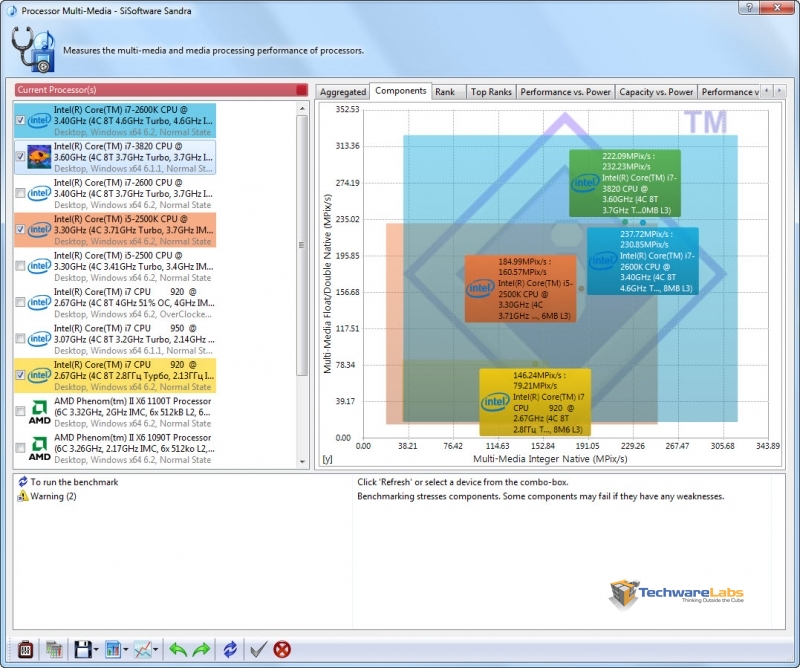
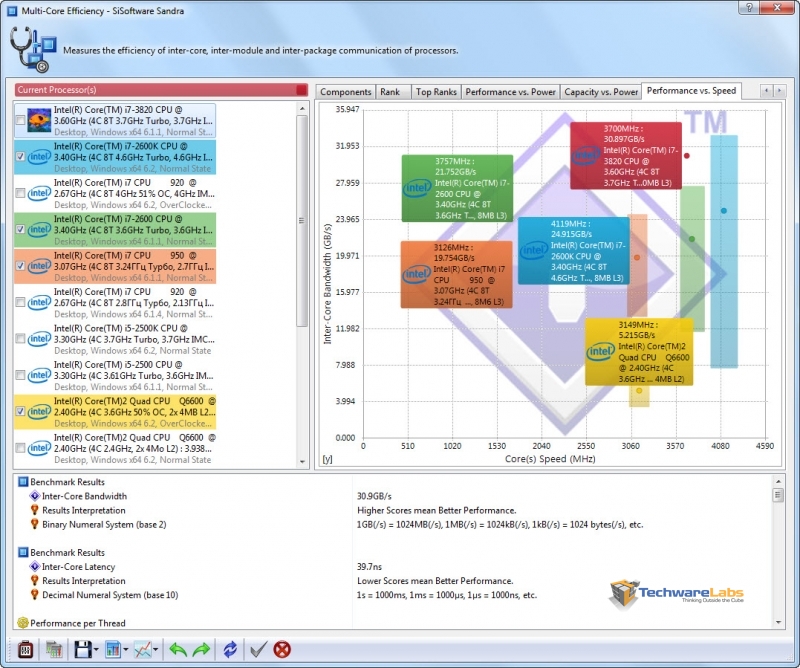
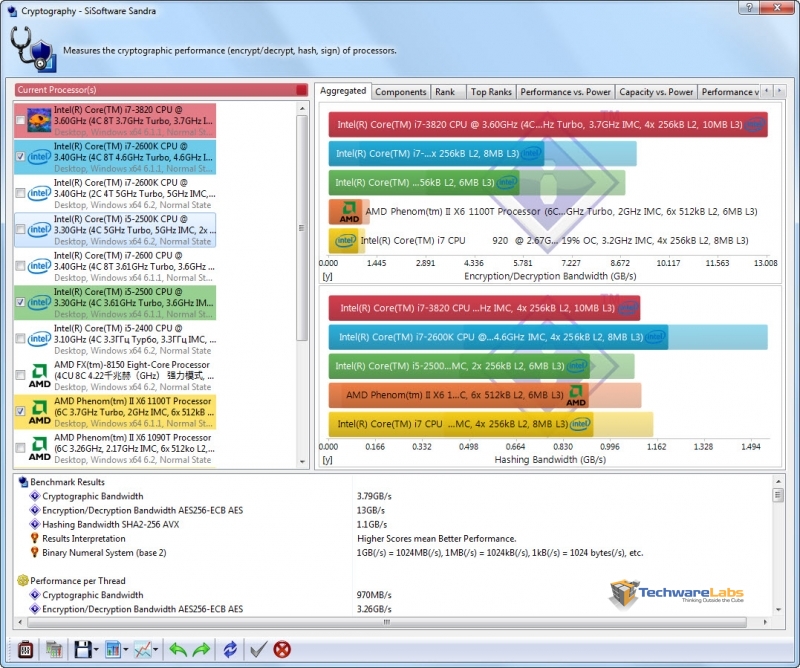
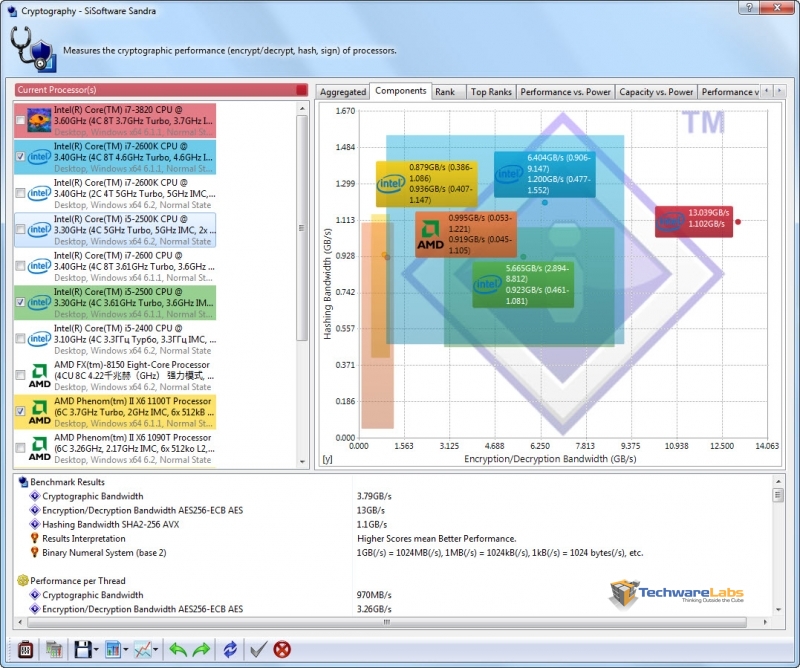
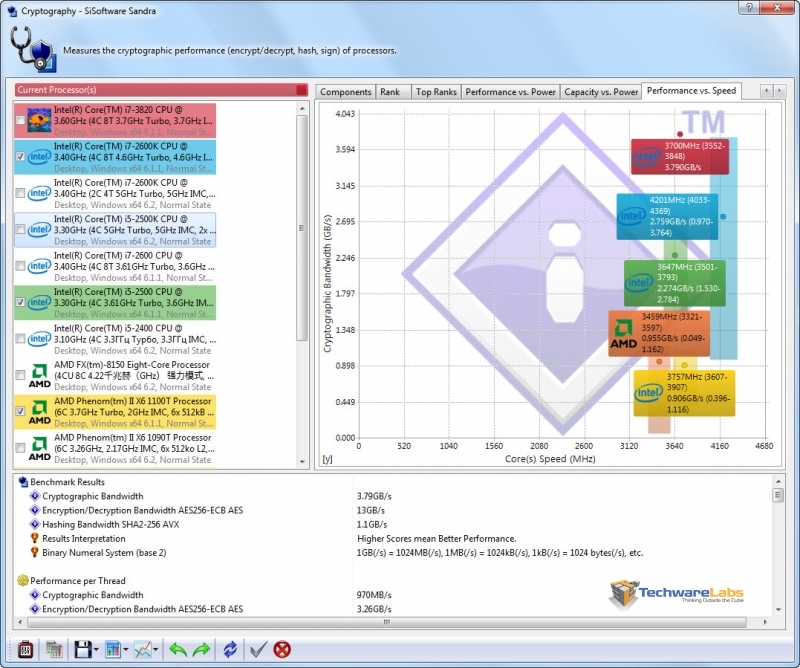
The table below has 5 rows, 1 for each test; each row has 3 graphs. The left graph is the combined result, the center graph compares the 2 components tested, the last right chart is ‘Performance vs Speed’ best results of this graph are furthest to the right and nearest the top of the chart.
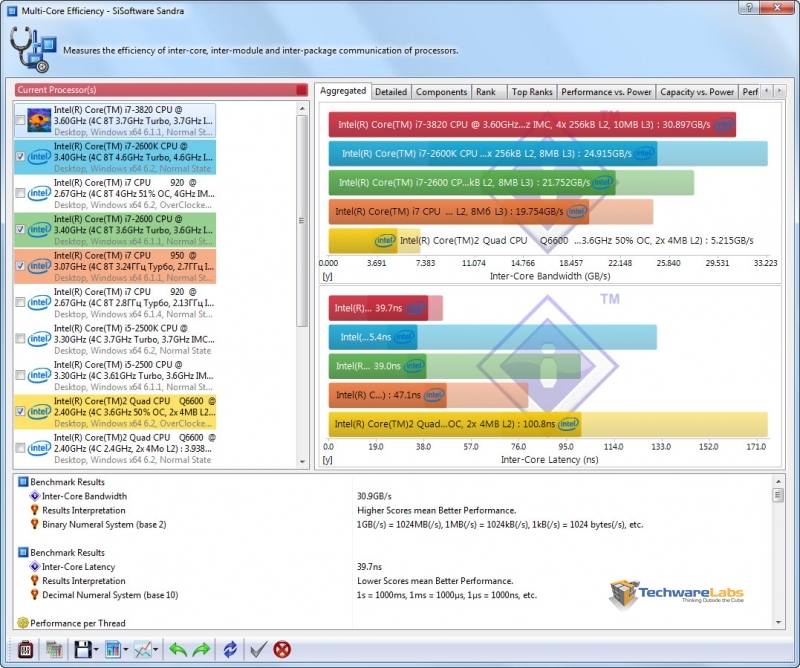
Overall the results translate as follows: higher results or longer bars equal better performance, with the exception of the Multi-Core Efficiency latency test in row 3 highlight in orange (bottom half of the image labeled ‘Inter-Core Efficiency’).
Processor Arithmetic: Benchmarks the ALU and FPU processor units. Shows how your processors handle arithmetic and floating point instructions in comparison to other typical processors.
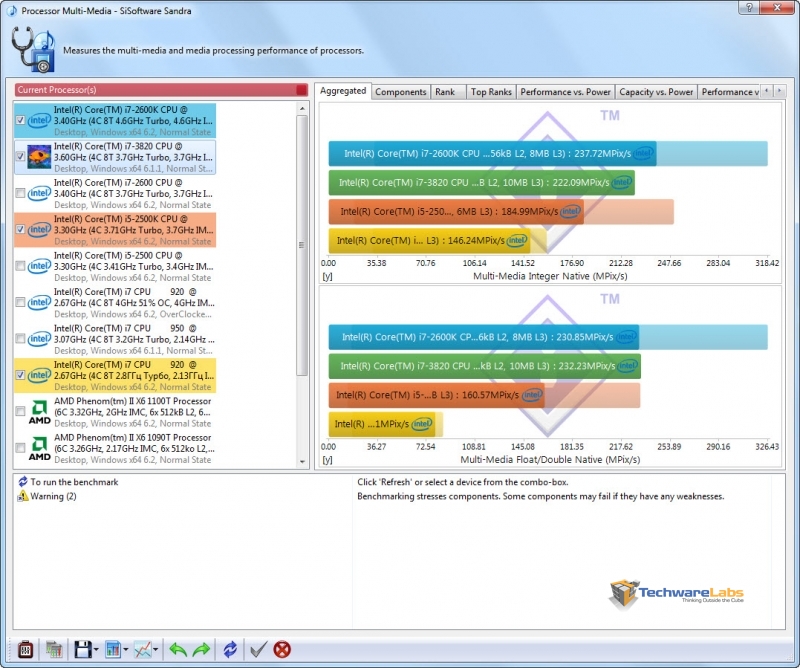
Processor Multi-Media: Benchmark the SIMD processor units. Shows how your processors handle multi-media instructions and data in comparison to other typical processors.
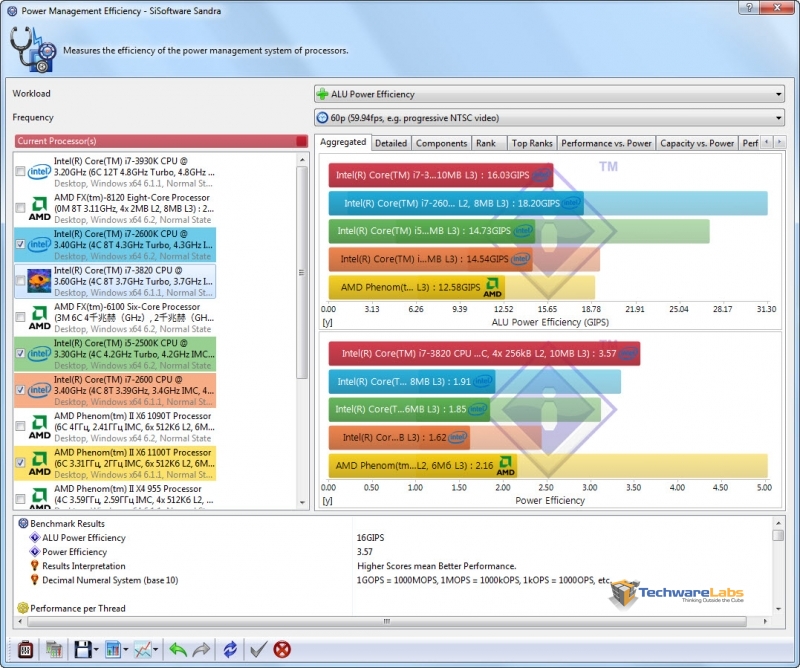
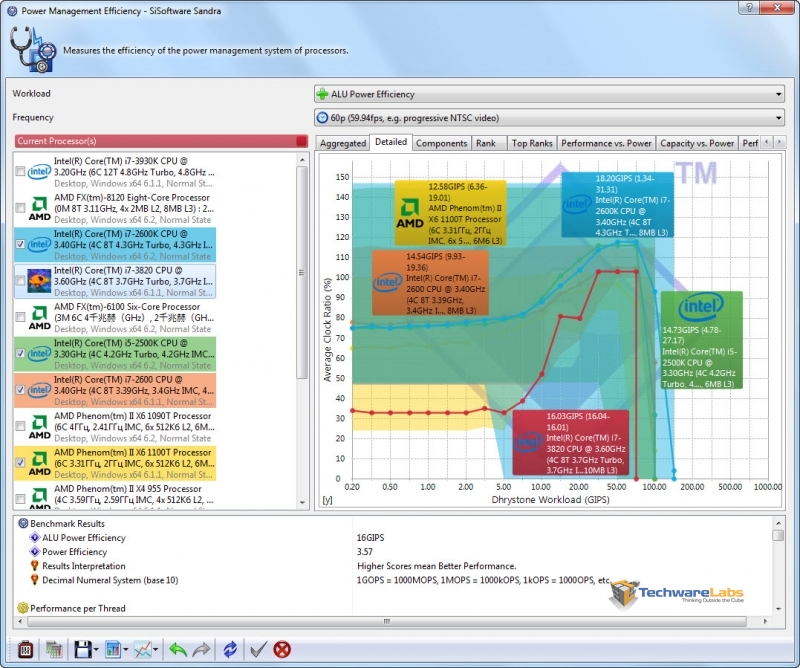
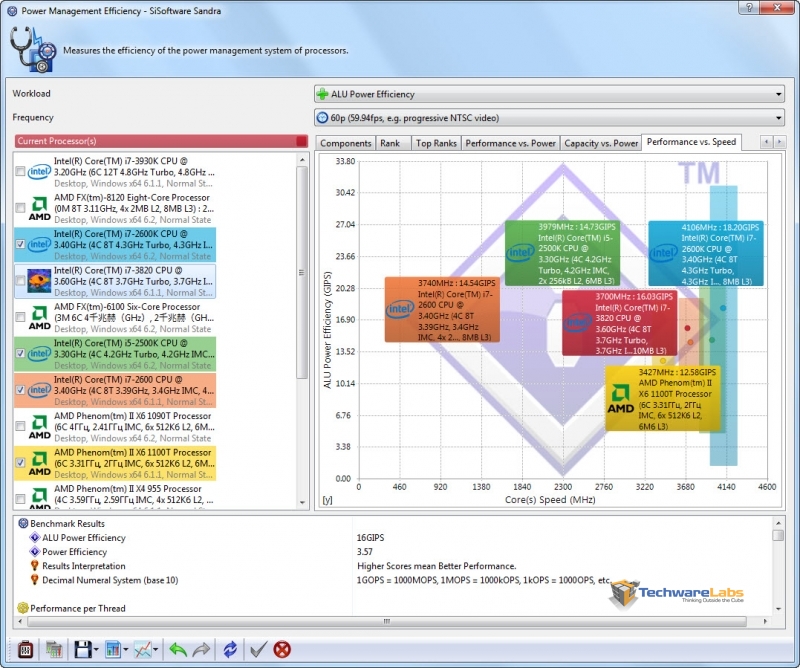
Power Management Efficiency: Benchmark the power management efficiency of the processors. Shows how efficient the power management of your processors is in comparison to other typical processors.The ability of the processors to step-down in frequency and voltage at different workloads is measured. The more a processor steps down in both frequency and voltage the better the score at the specific workload. The test stops when the workload is too great the processor even at 100% efficiency.
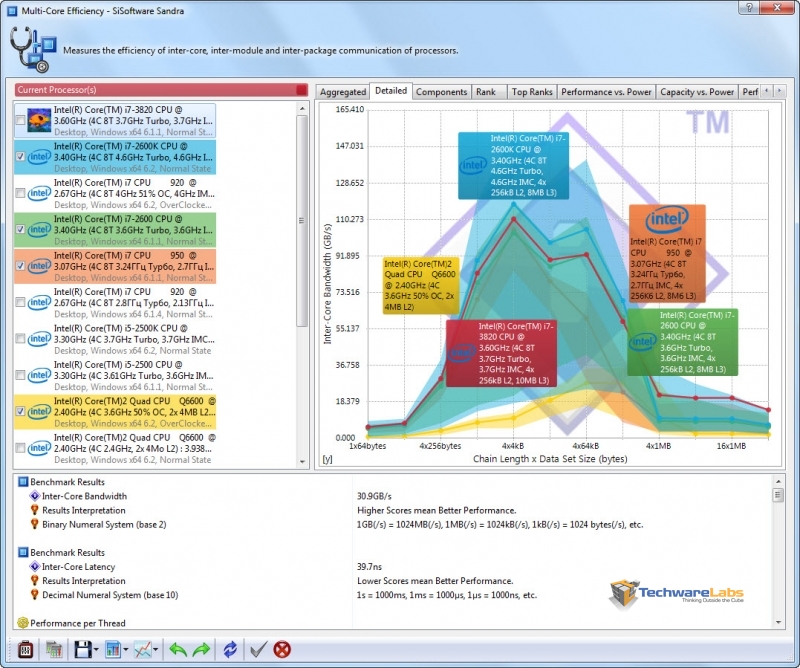
Multi-Core Efficiency: Benchmark the multi-core efficiency of the processors. Shows how efficient the processor cores and their inter-connects are in comparison to other types to other typical processors. The ability of the cores to process data blocks and pass them to another core for processing (producer-consumer paradigm) of different sizes and different chain sizes is measured. The efficiency of the inter-connect between cores is thus benchmarked; however, the number of cores (and processors) also counts as more data buffers can be processed simultaneously (aka “in flight”).
Cryptography: Measures the cryptography efficiency of the processor units: encryption, decryption and hashing. Shows how your processors handle cryptographic operations in comparison to other typical processors.
 |
 |
 |
| Processor Arithmetic | ||
 |
 |
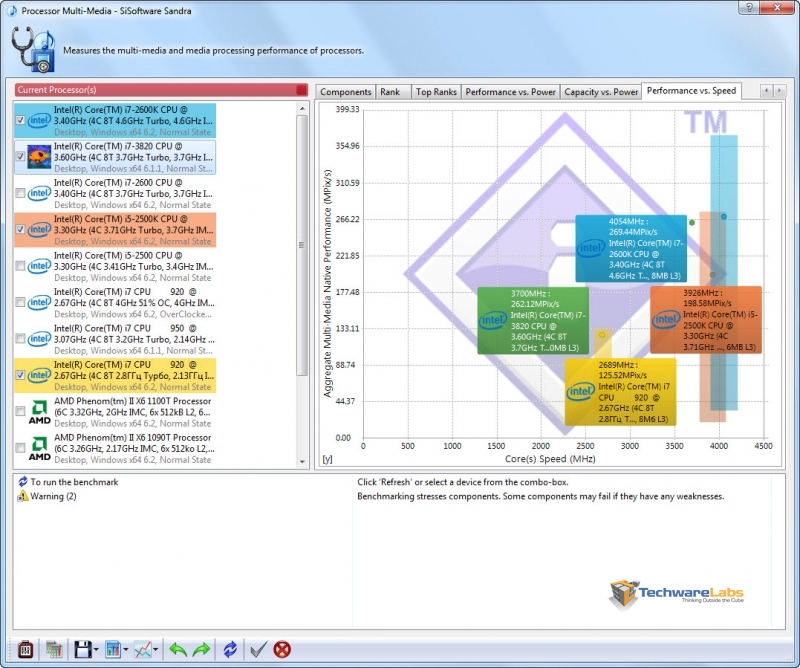 |
| Processor Multi-Media | ||
 |
 |
 |
| Multi-Core Efficiency | ||
 |
 |
 |
| Power Management Efficiency | ||
 |
 |
 |
| Cryptography | ||

Here is an overview of an Intel based Dell PowerEdge R720 : https://www.youtube.com/watch?v=wxkjrQ4UbJk