Cinebench R10
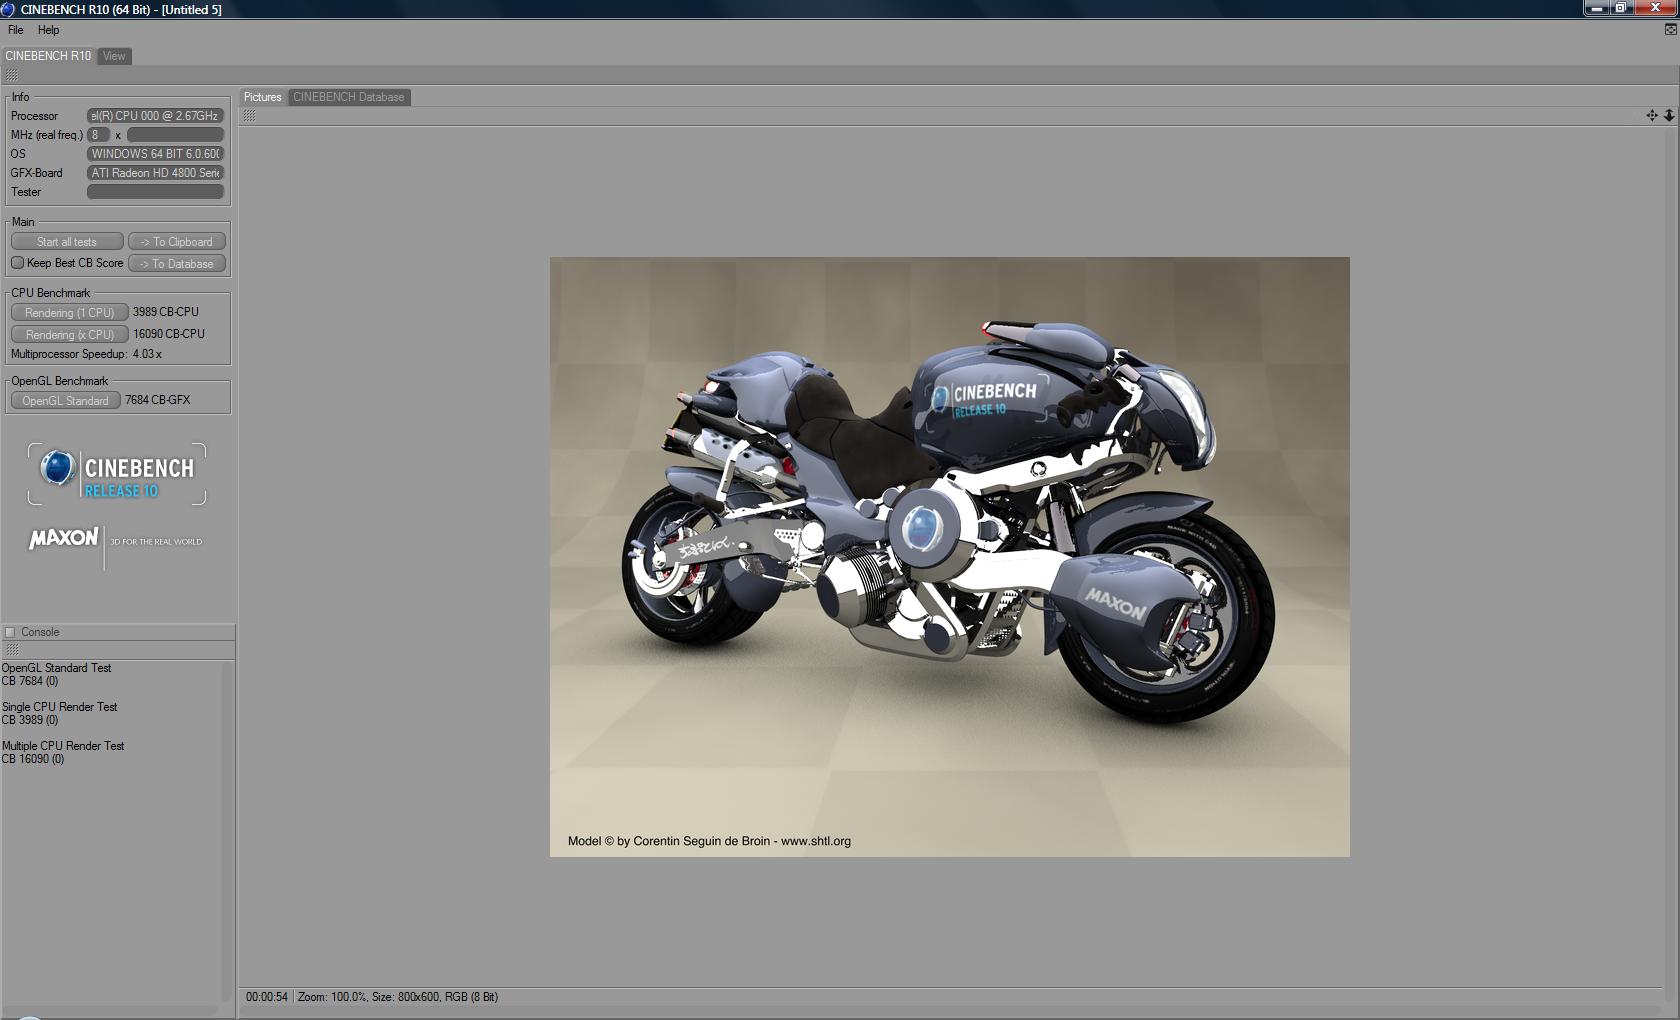
MAXON CINEBENCH runs several tests on the computer to measure the performance of the processor and graphics card under real-world circumstances and can make use of up to 16 CPUs or CPU cores. Cinebench’s test process is in two-phases: The first test procedure is directed against the CPU using a 3D render scene and photo realistic image settings to test how fast the CPU can produce the fully rendered scene. During the 1st pass of the test, the benchmark will only use one CPU, or in a multi-CPU core system it will use only a single CPU core to render the photo realistic scene to get a base value against which it will then perform the 2nd phase of the test using all of the CPU cores available. Higher Frames/Second and lower rendering time in seconds equals better performance. In this particular program is where this type of processor can shine at its fullest. The two scores you see in the test below reflect the speed at which a single core of the processor was able to decode the picture versus the speed at which the processor was able to decode the picture using all the cores simultaneously. As you can see, Cinebench takes full advantage of the 4 actual cores of the processor along with its 4 “virtual cores” from hyper threading. During the overclock settings the processor experienced a 4x boost from the multi-threading. The single core score was able to score 3989 while the multicore results were 16090, thus providing a significant performance increase.
SiSoft Sandra
“SiSoftware Sandra (the System ANalyser, Diagnostic and Reporting Assistant) is an information & diagnostic utility. It should provide most of the information (including undocumented) you need to know about your hardware, software and other devices whether hardware or software. It works along the lines of other Windows utilities, however it tries to go beyond them and show you more of what’s really going on. Giving the user the ability to draw comparisons at both a high and low-level. You can get information about the CPU, chipset, video adapter, ports, printers, sound card, memory, network, Windows internals, AGP, PCI, PCI-X, PCIe (PCI Express), database, USB, USB2, 1394/Firewire, etc.”
In the SiSoft Sandra tests, the Core i7 920 performed amazingly well. It was the hands down winner in every category of the SiSoft Sandra tests.
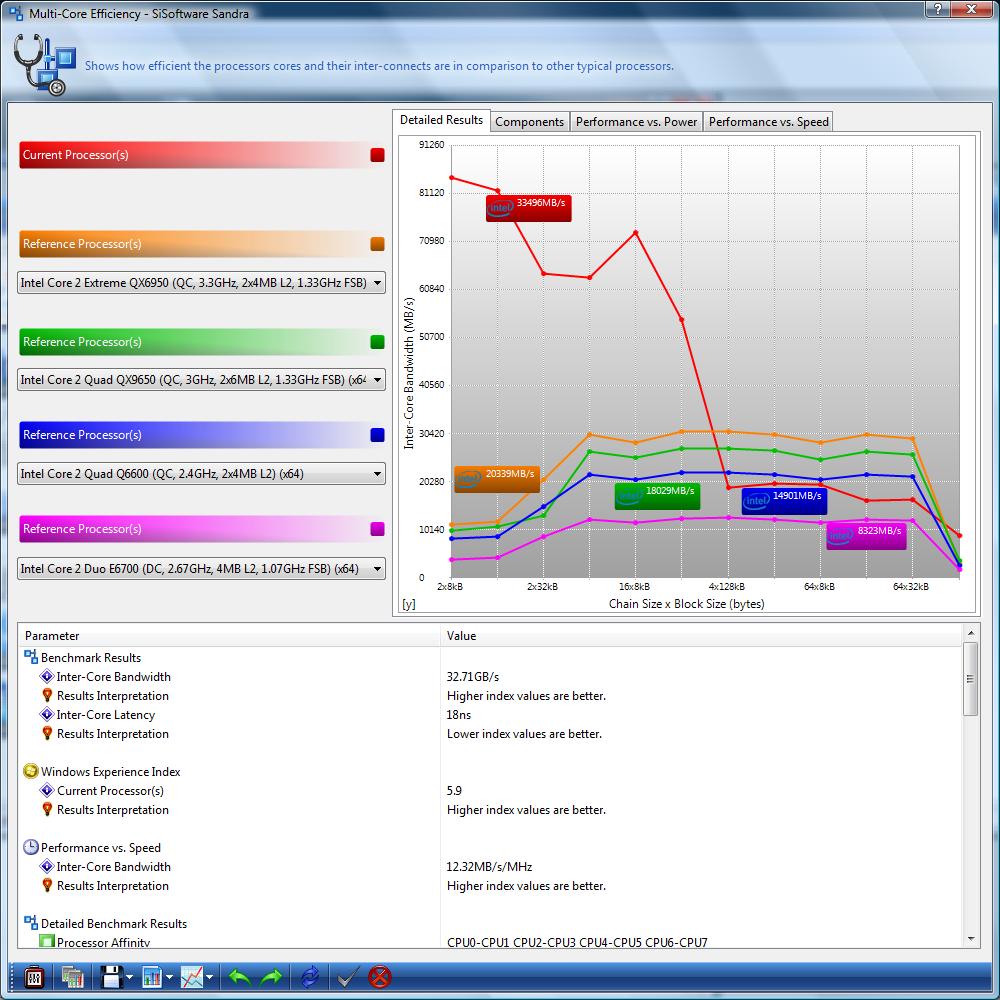
Multi-Core Efficiency is a self explanatory benchmark. It evaluates how efficiently the processor can use all of its cores. Much like in the previous case, the higher the number the better the processor. In this case we are not looking at the speeds, but rather efficiency. This means that the higher number signifies a processor is able to coordinate work between all of its cores better. In this case it is a ratio, so a slower processor that has high efficiency might also be placed high in this particular test, however, the norm is that the newer processors have better capabilities in utilizing all of the cores simultaneously and thus generally trump the older processors.
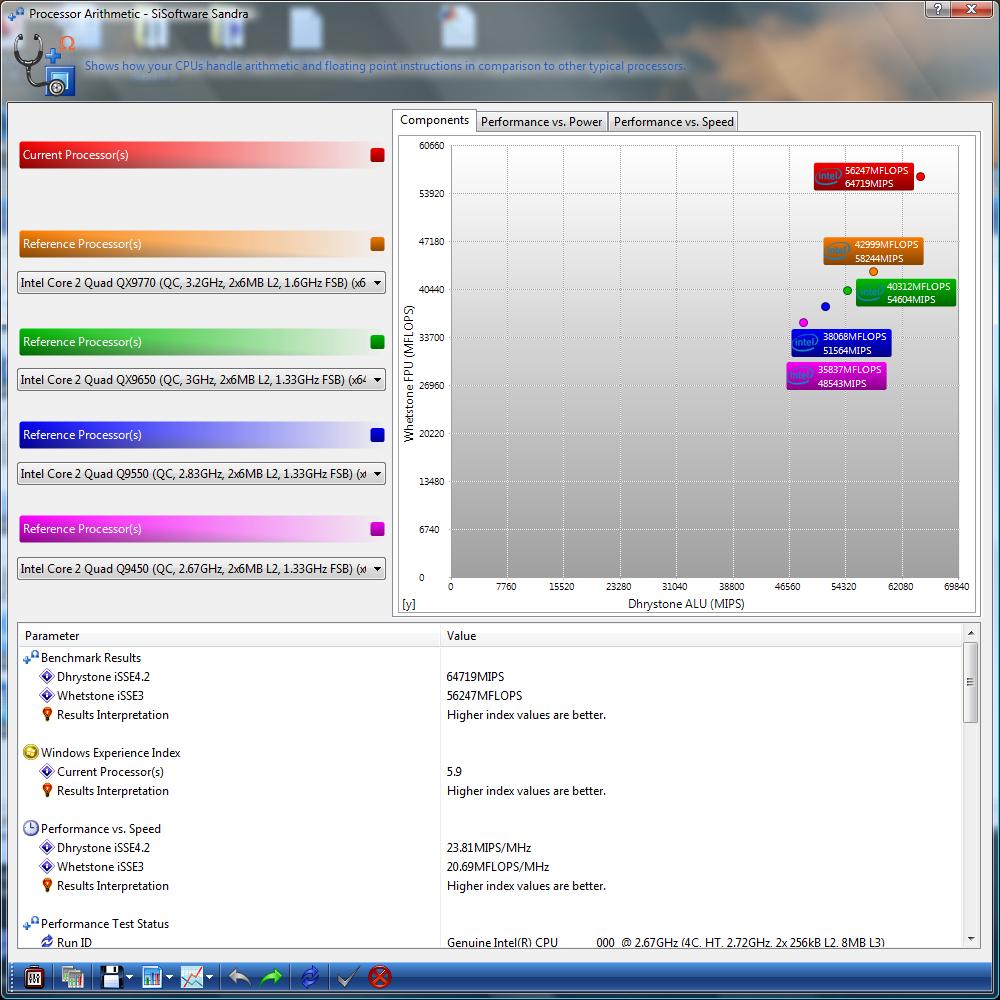
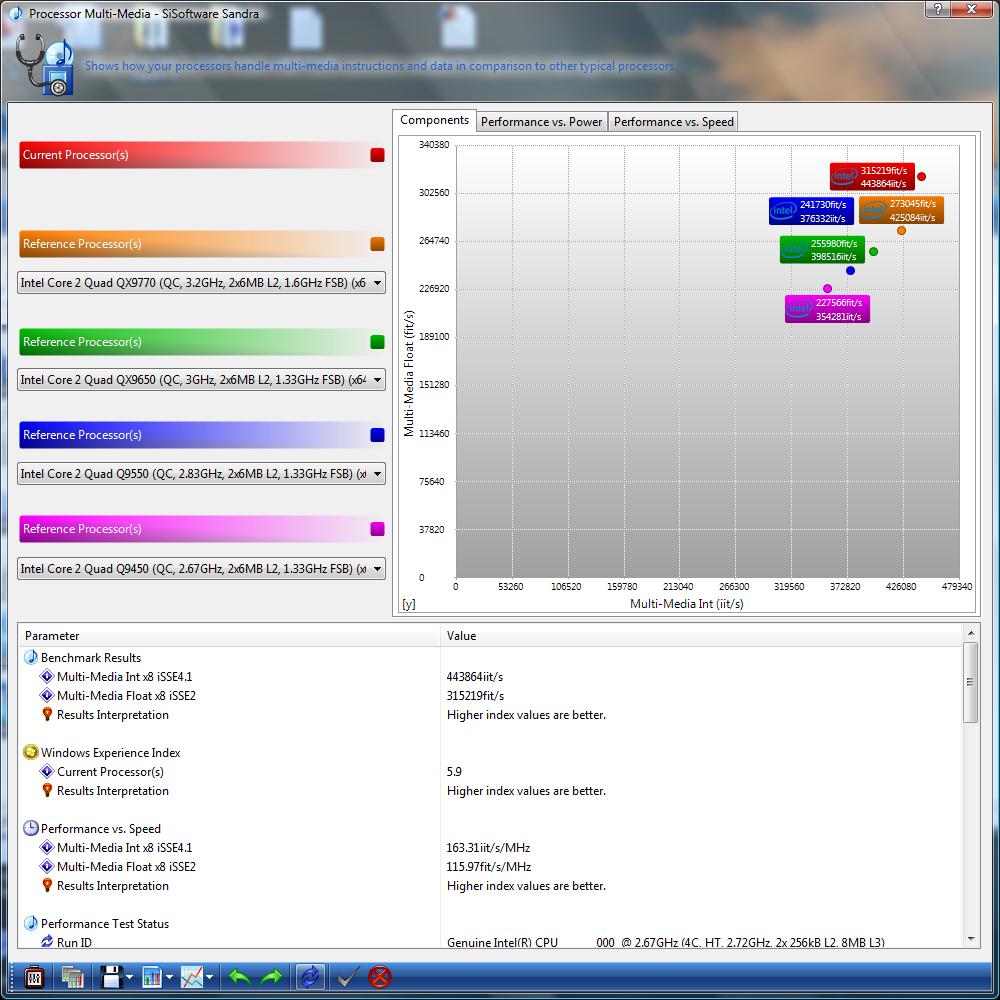
Processor Arithmetic benchmark is also more or less self explanatory. SiSoft Sandra runs a series of arithmetic calculations and finds out what is the maximum amount of calculations the processor can perform in a single time interval. Obviously, the higher the number, the more calculations a particular processor can perform which translates into a better score and better results for the processor. In our case our processor scored a total of 56247 Mega FLOPS and 64719 MIPS, which was higher than all its predecessors at stock speeds as described in the comparison chart.
WinRAR
WinRAR is a more “Real World” benchmark. It determines the speed at which your processor can compress files using WinRAR’s compression algorithm. This particular test is also very handy in determining the effects of multithreading on the total throughput of the processor. As you can see below, the Core i7 is capable of processing approximately 3 MB of information per second. This estimate was given after processing 49 MBs in 16 seconds.


When we test hardware, we try to do everything that we can to make the bottleneck of the rig that piece of hardware. In this review, the reviewer was using 2 – 4870’s in Crossfire. This gives a fairly good benchmark point for what you will expect to see.
I find all the game benches to be lacking in comparative data. All we find out is where your rig gives out of being playable, not how much a difference the 920 is doing. It could very well be that you are reaching the capacity of what the graphics card is able to display and that the CPU isn’t involved much at all.
Nice! I need this information. But could you tell me what the “PCG 08” means?
PCG is a processor power specification to help identify thermal solutions, power supplies, and chassis that will meet specific power requirements. The PCG mark can be found on the box label and engraved on the IHS of the processor.
Great Blogging!!
Keep Your Good Work Going!!
Pretty cool post. I just came across your site and wanted to say
that I’ve really liked reading your blog posts. Any way
I’ll be subscribing to your feed and I hope you post again soon!
Hey, nice post, very well written. You should post more about this.