Test System
We will be comparing the MSI 280 OC to the Sapphire 290X Tri-X.
- Intel Core i7-4960X
- Asus P9 X79-E WS Motherboard
- ADATA XPG V2 DDR3 2600 MHz 16 GB RAM kit
- ADATA SX900 128GB SSD
- NZXT Phantom 410 Case
- Corsair H100 CPU Cooler
- Thermaltake Toughpower 1350W Power Supply
3DMark
 |
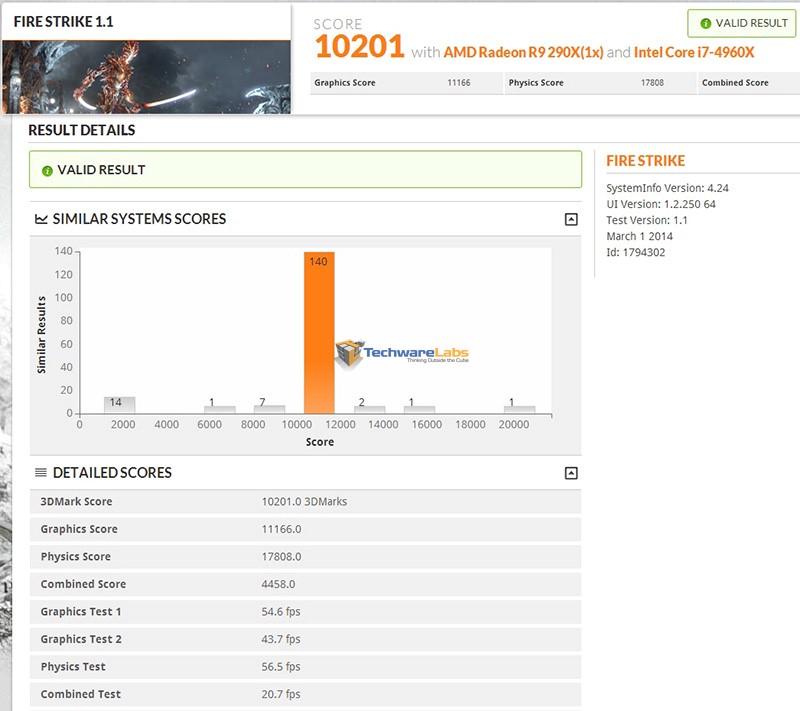 |
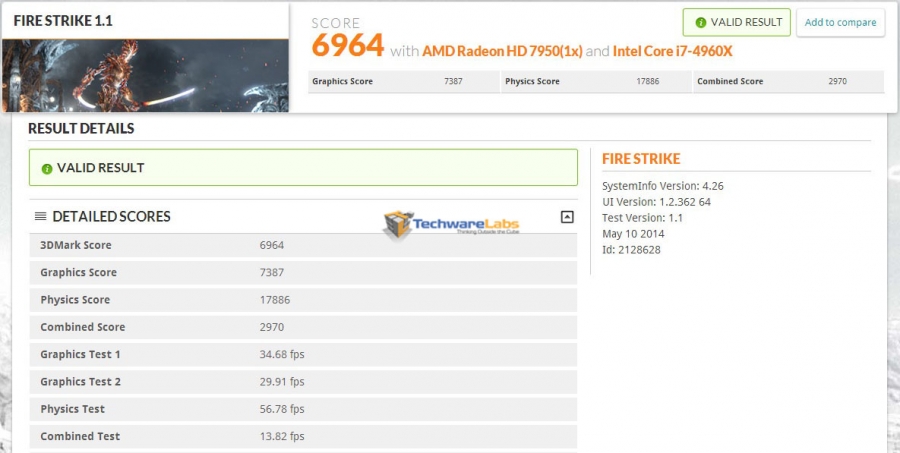
We start off our synthetic benchmarks with the benchmark staple, 3DMark. The Fire Strike test in particular is able to really test the limits of modern gaming machines. Our 280 OC Edition managed a score of 6964 and averaged around 30-35 fps in the graphics tests. To give you an idea of where that stacks up with the super high-end, we’ll compare it to the Sapphire 290X Tri-X. As you would expect from a card that costs over double the price, the 290X beat the 280 by quite a bit, scoring 10201 points.
Furmark
 |
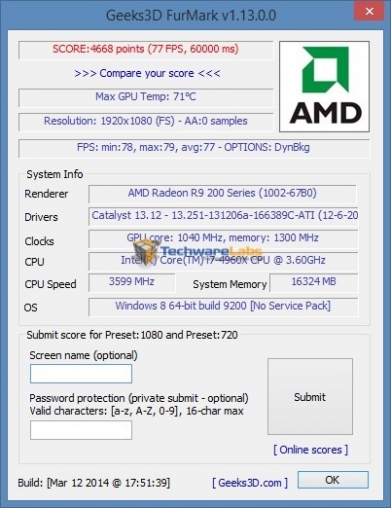 |
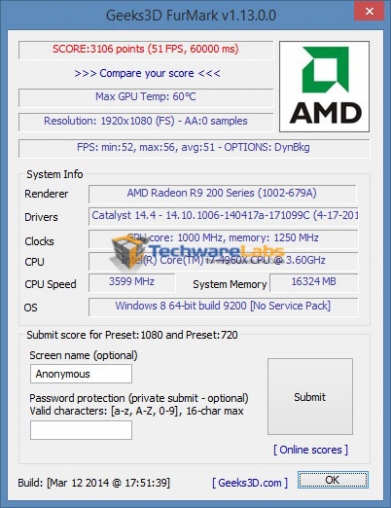
FurMark is most known for its GPU stress test which can handily bring a graphics card to its max temp in just a few minutes. But FurMark also has a built-in benchmark function where we scored a 3106 at 51 fps while our 290X scored 4668 and averaged 77 fps.
The key is the temp which was well below the 290X’s. We’ll discuss this more in the temperature section.
Unigine Heaven
 |
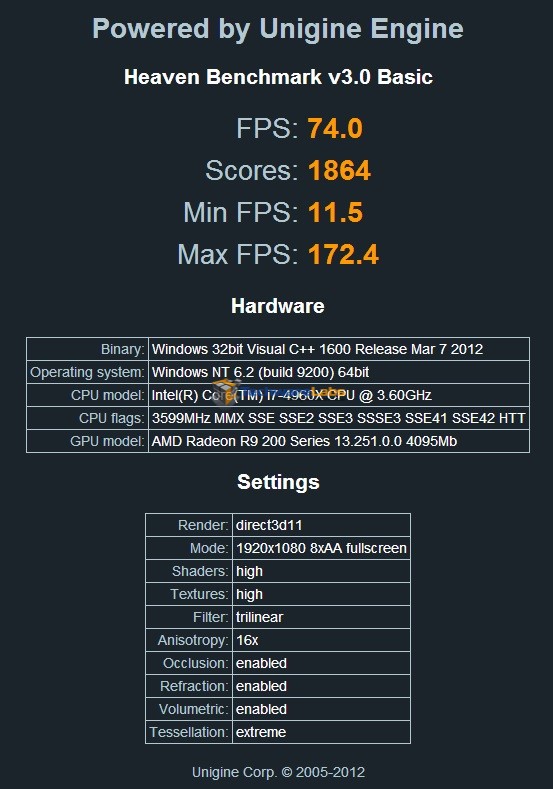 |
The heaven benchmark was designed to specifically test the key features in DirectX 11 and is an excellent benchmark for general GPU performance.
With all settings maxed out, our 280 averaged 44.3 fps, giving it a score f 1115. The 290X score 1864 at 74 fps.

[…] MSI Radeon R9 280 OC Review @ TechwareLabs.com […]
[…] MSI Radeon R9 280 OC Review at TechwareLabs.com […]