Aida64
 |
 |
| Aida64 Julia | Aida64 Mandel |
 |
 |
| Aida64 Sinjulia | Aida64 VP8 |
*taken from AIDA64’s benchmarking guide
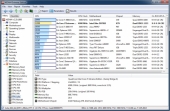
Aida64 Julia (SCORE 21098): This benchmark measures the single precision (also known as 32-bit) floating-point performance through the computation of several frames of the popular “Julia” fractal. The code behind this benchmark method is written in Assembly, and it is extremely optimized for every popular AMD, Intel and VIA processor core variants by utilizing the appropriate x87, 3DNow!, 3DNow!+, SSE, AVX or FMA4 instruction set extension.
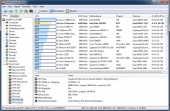
Aida64 Mandel (SCORE 11181) : This benchmark measures the double precision (also known as 64-bit) floating-point performance through the computation of several frames of the popular “Mandelbrot” fractal. The code behind this benchmark method is written in Assembly, and it is extremely optimized for every popular AMD, Intel and VIA processor core variants by utilizing the appropriate x87, SSE2, AVX or FMA4 instruction set extension.
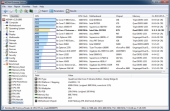
Aida64 Sinjulia (SCORE 5345): This benchmark measures the extended precision (also known as 80-bit) floating-point performance through the computation of a single frame of a modified “Julia” fractal. The code behind this benchmark method is written in Assembly, and it is extremely optimized for every popular AMD, Intel and VIA processor core variants by utilizing trigonometric and exponential x87 instructions.
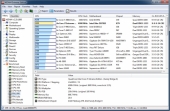
Aida64 VP8 (SCORE 3699): This benchmark measures video compression performance using the Google VP8 (WebM) video codec Version 0.9.5 (http://www.webmproject.org). FPU VP8 test encodes 1280×720 pixel (“HD ready”) resolution video frames in 1-pass mode at 8192 kbps bitrate with best quality settings. The content of the frames are generated by the FPU Julia fractal module. The code behind this benchmark method utilizes the appropriate MMX, SSE2 or SSSE3 instruction set extension, and it is HyperThreading, multi-processor (SMP) and multi-core (CMP) aware.
SiSoft Sandra
SiSoft Sandra allows us to not only benchmark the Sapphire 7950 OC but also compare its results to other users results. Lets go over each benchmark separately:
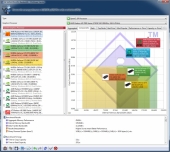
GPU Bandwidth (SCORE 45GB/s Aggregate, 179.8GB/s internal, and 11.23 Data Transfer): We see in this benchmark that our 7950 beats every card tested. Without knowing the testing rig (or the use of PCIe 3.0 we cannot conclusively say that the 7950 is the best but it is obviously up there.
GPU Processing (SCORE 1.87GPix/s, 3.67GPix/s Native Float, 952.1MPix/s Native Double Shaders: Yet again the 7950 is way above any other card tested in processing performance.
Video Rendering (SCORE 911.85MPix/s Aggregate Shader, 1.29GPix/s Native Float, 645.58MPix/s): Same story. Our 7950 in the i7-3820 setup trumps all other competitors.
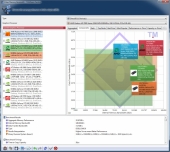
Video Memory Bandwidth (SCORE 32.87GB/s Aggregate, 148.84GB/s Internal, 7.17 GB/s Data Transfer): Again, no match.
 |
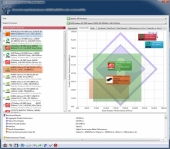 |
| GPU Bandwidth | GPU Processing |
 |
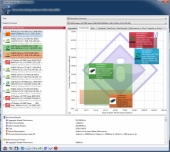 |
| Video Memory Bandwidth | Video Rendering |

No offense intended Ben, but you need to get the marbles out of your mouth. I can’t understand half of what you are saying, most importantly the max stress temp. It could be only me, but you might want to retake the video, or at least clean up the audio. Thanks