Testing and Overclocking
Motherboards, much like cars tend to differ. An example can be drawn from performance specs of two similar cars. Both cars could have 500 horse powers but one would outperform the other. Why? Difference in build quality. Same can be applied to motherboards and the only way to find out that build quality is to test drive them.
Testing Rig:
- PSU – Kingwin MACH 1 – 750 W
- Processor: Intel Core i7 920 (2.66 GHz base speed)
- Graphics: ATI Radeon 4870 from Palit
- Case: LianLi PC-A77
- RAM: Patriot Sector 7, 6 GB @ 1800 MHz
- HDD: 2xRaptor 650 GB in RAID 0
CPUZ
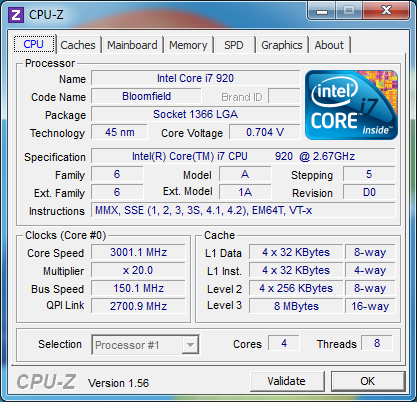
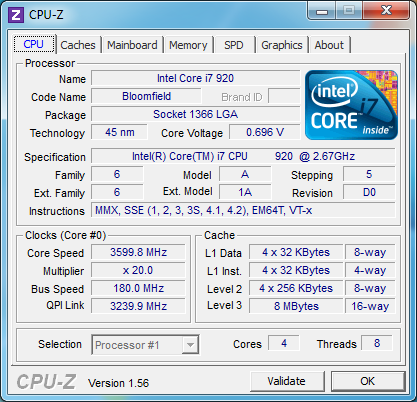
Overclocking this board was a fairly easy thing to accomplish. Just by setting up the XMP Profile in the Patriot RAM overclocked the 920 processor to 3.0 GHz as can be seen in the pictures below. Following along with the overclock and modifying the bclock frequency a bit, I was able to easily obtain 3.5 GHz out of the 920 processor while setting the RAM to 1600 MHz and keeping the timings the same as in the XMP profile. These overclocks were all done with automatic voltages and even at heavy loads the processor did not go beyond 50 C on Intel’s stock cooler.
 |
 |
| Default XMP – 920 @ 3.0 GHz RAM @ 1800 MHz |
Overclock: 920 @ 3.6 GHz
RAM @ 1600 GHz |
SiSoft Sandra
Arithmetic:
 |
 |
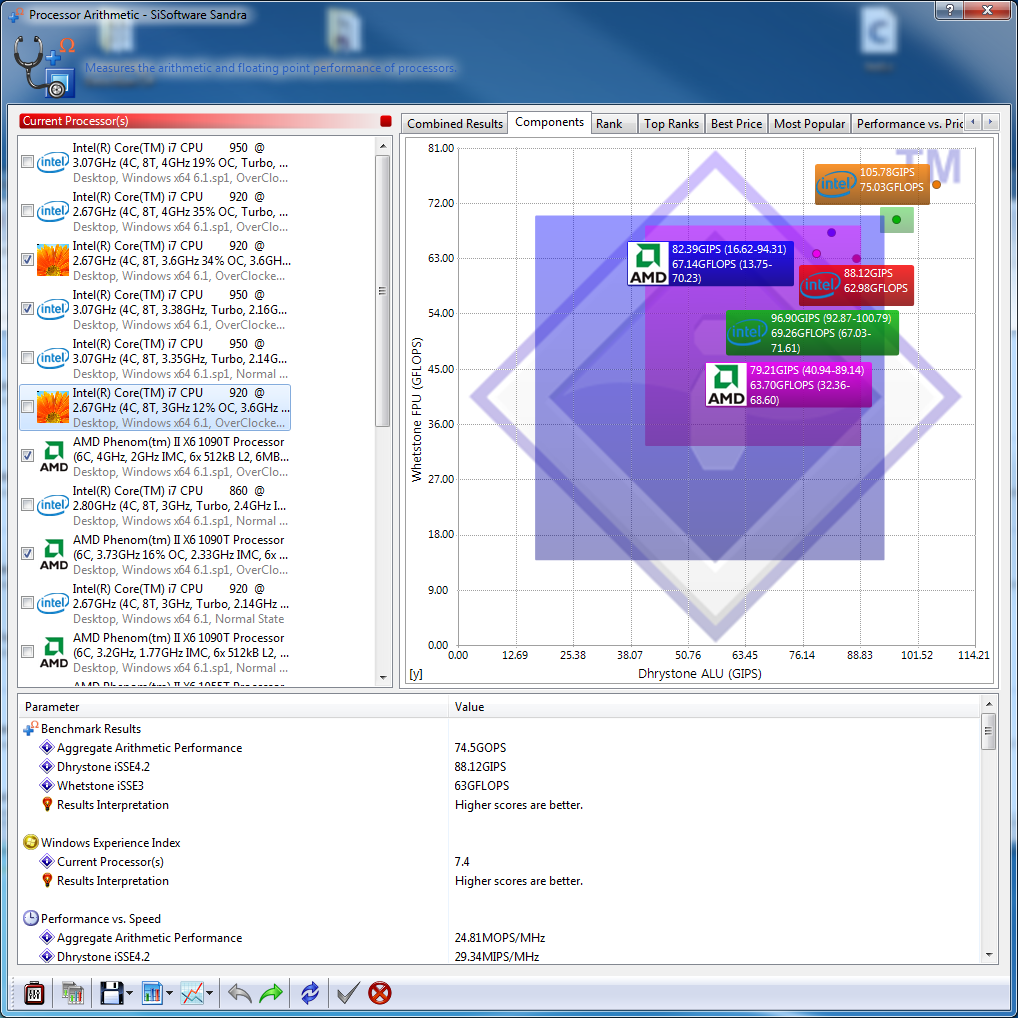
| Default XMP – 920 @ 3.0 GHz RAM @ 1800 MHz |
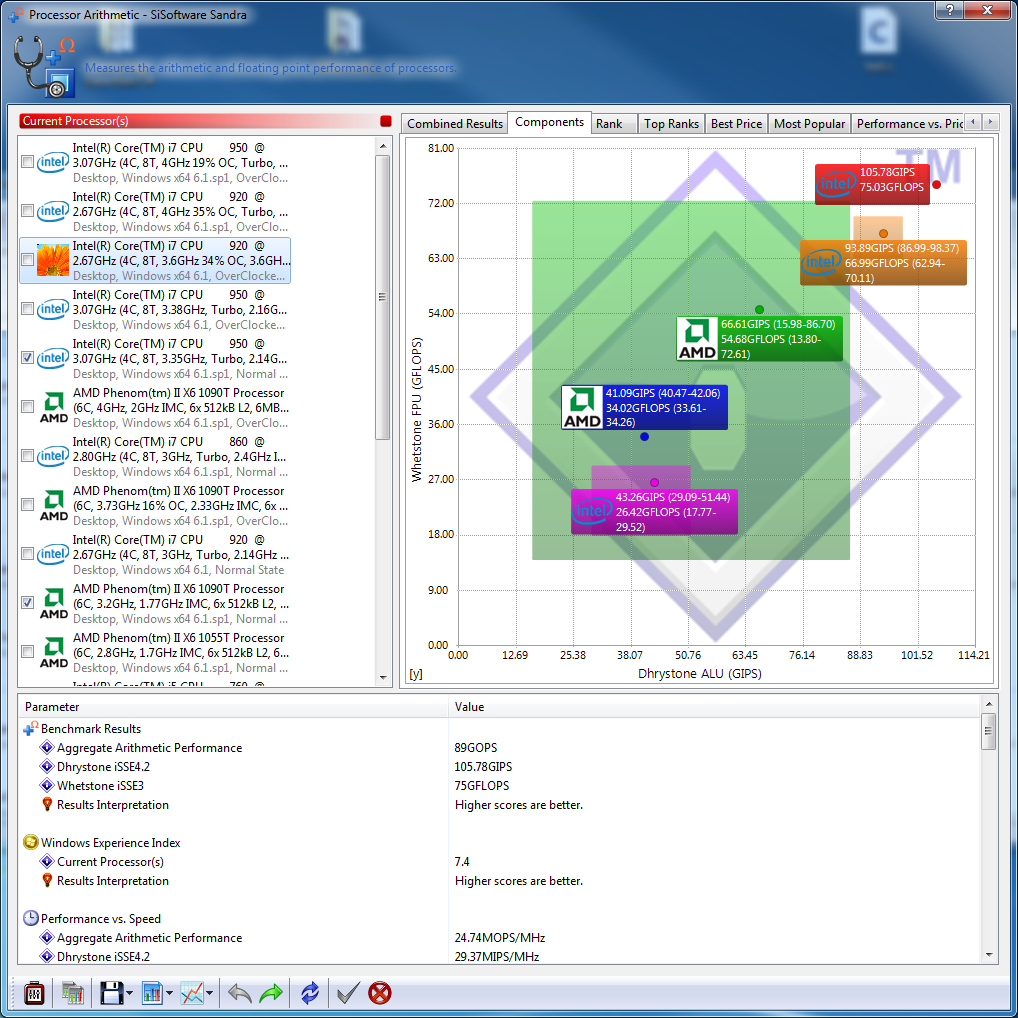
Overclock: 920 @ 3.6 GHz RAM @ 1600 GHz |
The bulk of the overclock can be felt here as raising clock speeds directly impacts the amount of instruction that the CPU can perform per second. Raising the speed from 3.0 GHz to 3.6 GHz translated into a 20 % gain in the number GOPS, raising the number from 74 GOPS to 89 GOPS.
Multi-Core Efficiency:
Multi-Core Efficiency is one of the things that is the least affected by overclocking because efficiency itself is a more of a factor of the design of the processor rather than pure processing power. Granted by incrementing the speed you would also be increasing the QPI speed, however, these increments are only marginal when compared to processor redesigns. This can be evidenced in the pictures below where the sandy bridge processors have better multi-core efficiency despite being clocked at lower speeds.
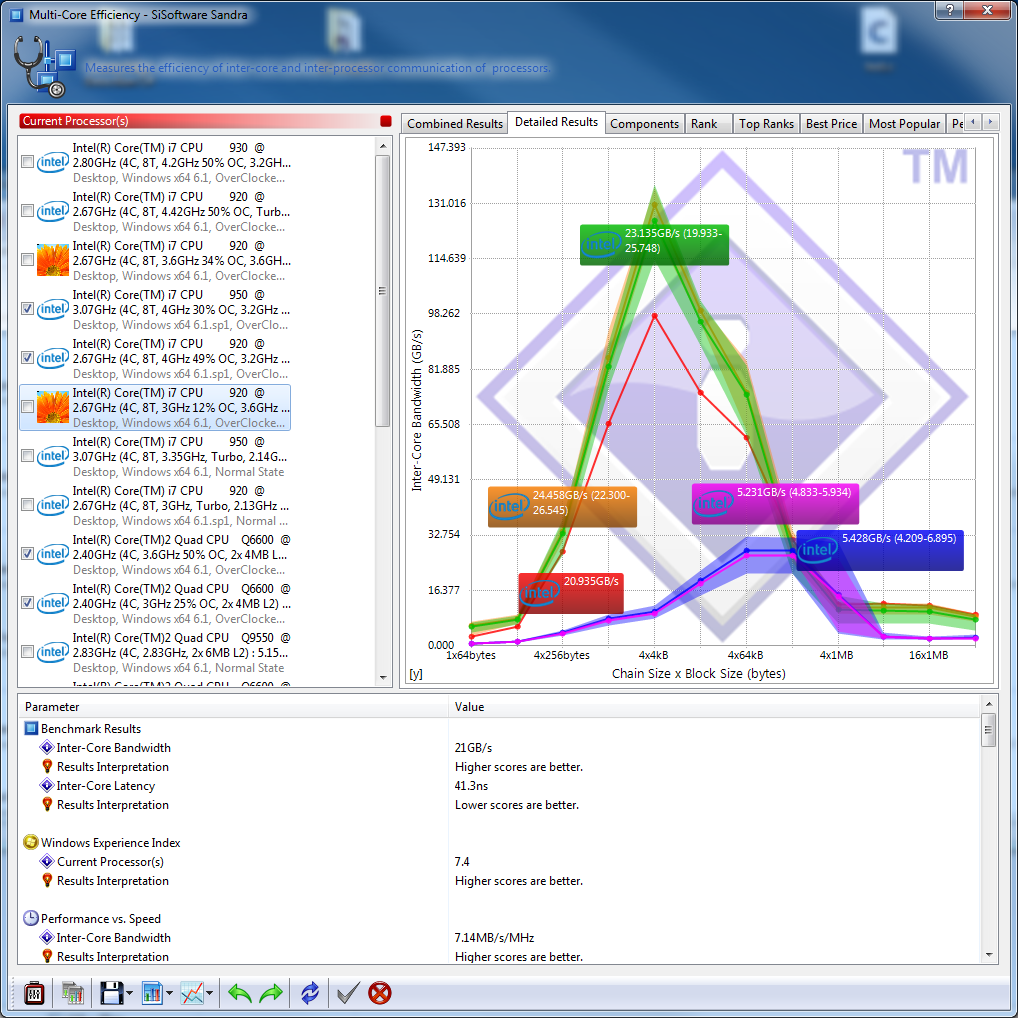 |
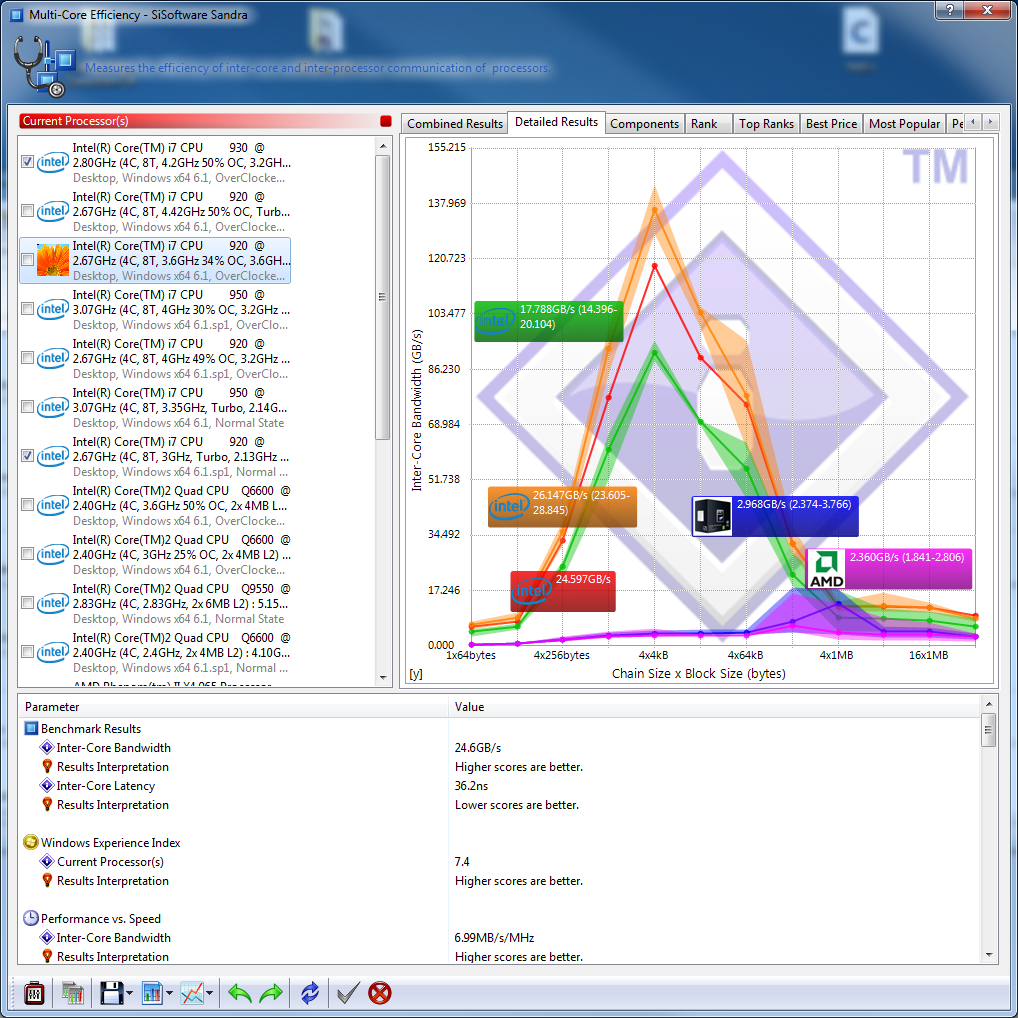 |
| Default XMP – 920 @ 3.0 GHz RAM @ 1800 MHz |
Overclock: 920 @ 3.6 GHz RAM @ 1600 GHz |
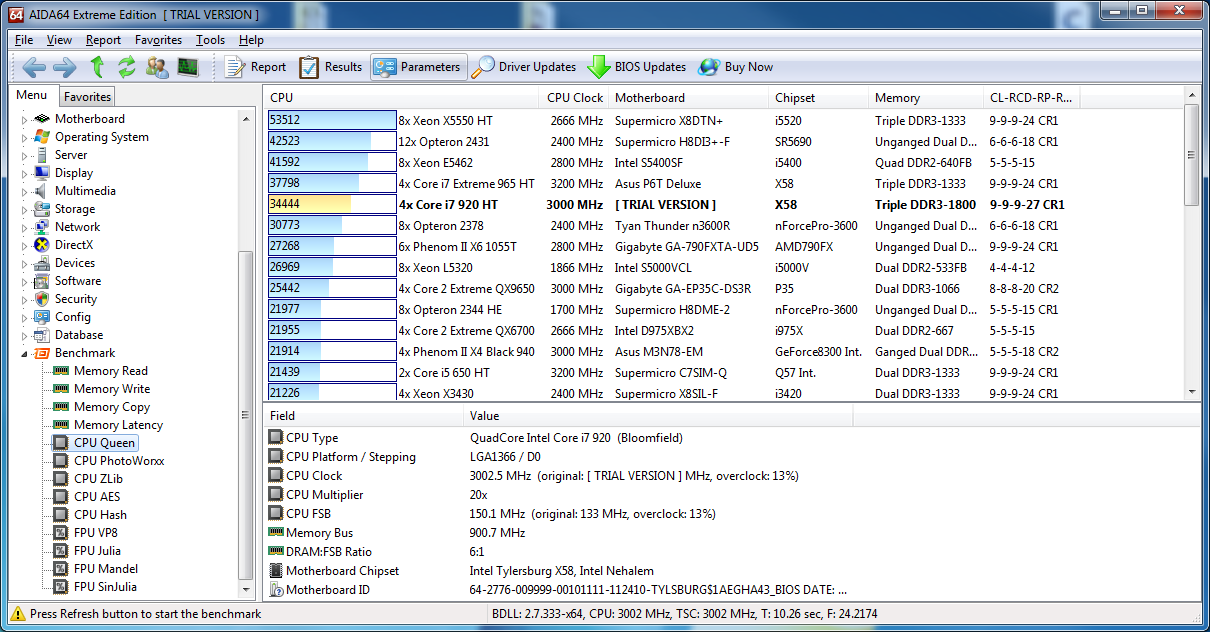
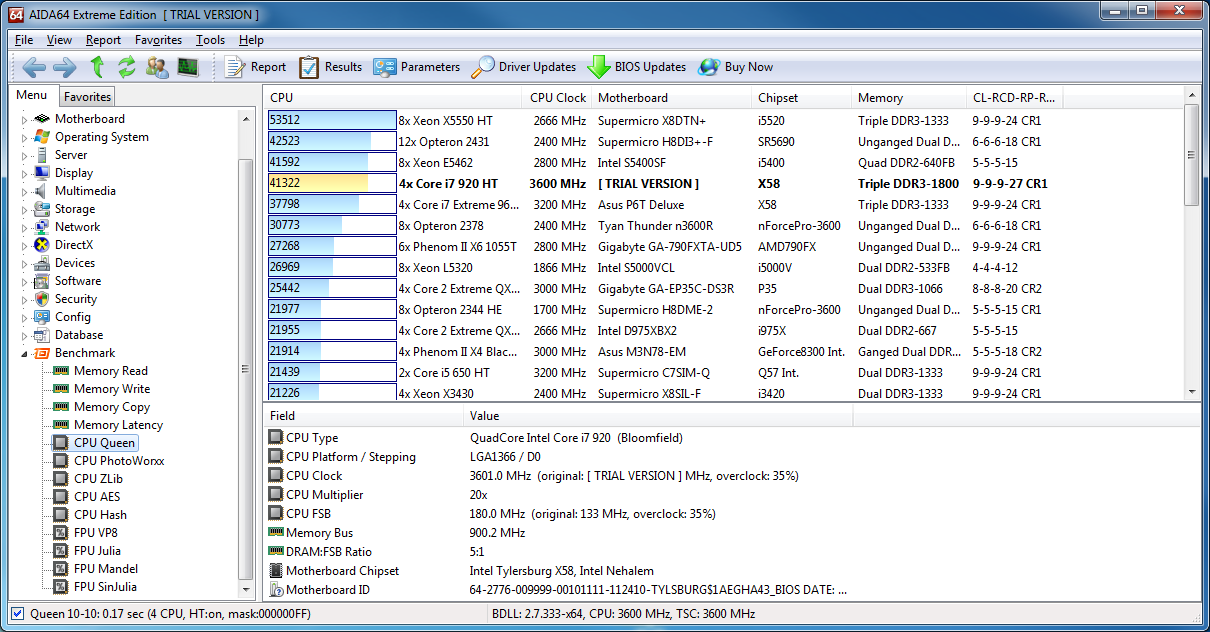
AIDA64 Benchmark
CPU Queen
CPU Queen benchmark places 10 queens in a 10 by 10 square. Faster processors will place the queens faster thereby generating a better score. In the default XMP profile the score for such an algorithm cam out to be in the 34k range, while 3.6GHz overclock earned it 41k score. The overclocked score earned the processor that a spot just above the Core i7 965 Extreme on a P6T.
 |
 |
| Default XMP – 920 @ 3.0 GHz RAM @ 1800 MHz |
Overclock: 920 @ 3.6 GHz RAM @ 1800 GHz |
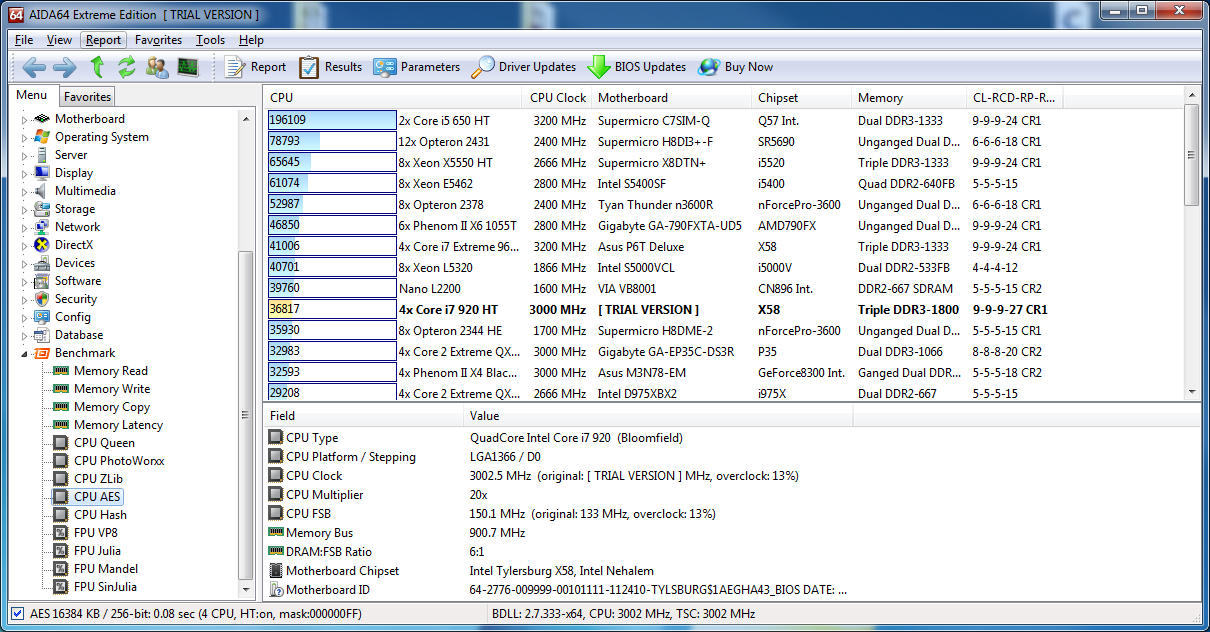
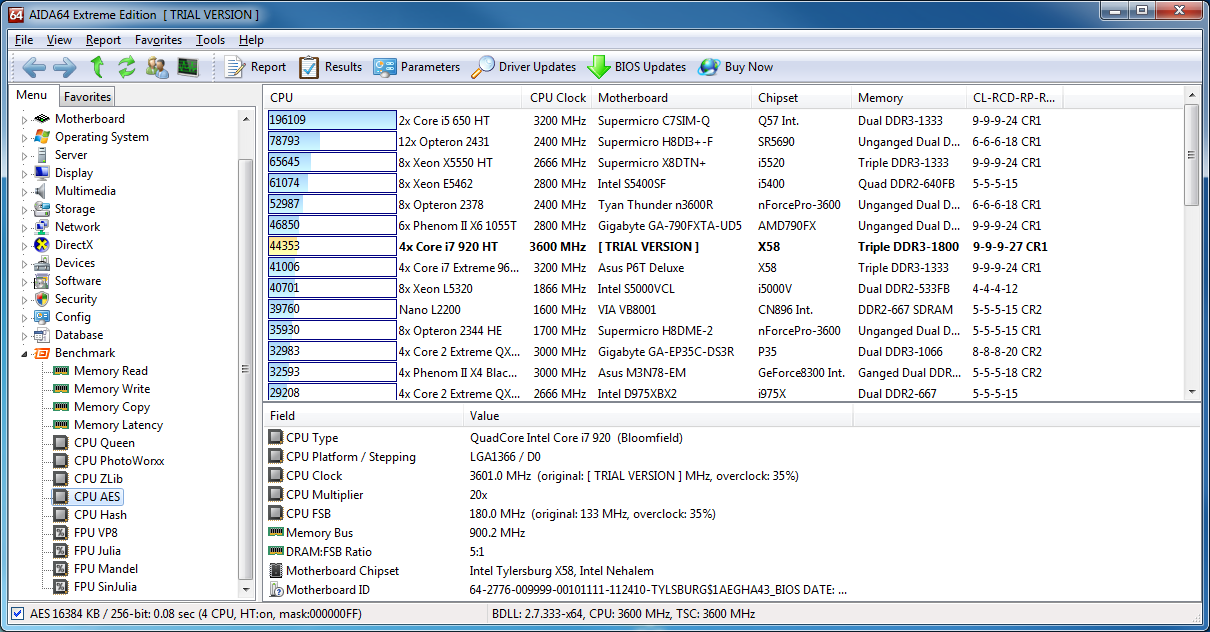
CPU AES
The AES benchmark runs a series of algorithms based on the AES encryption. Higher scores in this category translate better performance in areas applications such as WinZip, 7 Zip, bit locker, etc. The XMP profile generated a score of 34K and the overclock generated a score 22% better at 44K.
 |
 |
| Default XMP – 920 @ 3.0 GHz RAM @ 1800 MHz |
Overclock: 920 @ 3.6 GHz RAM @ 1800 GHz |
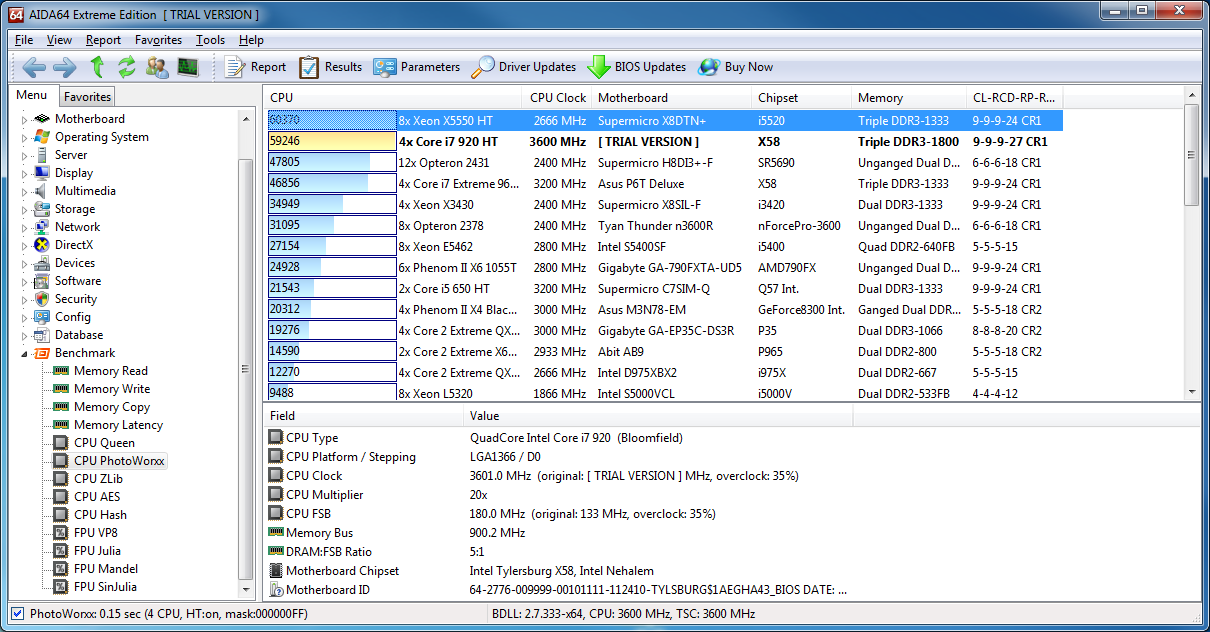
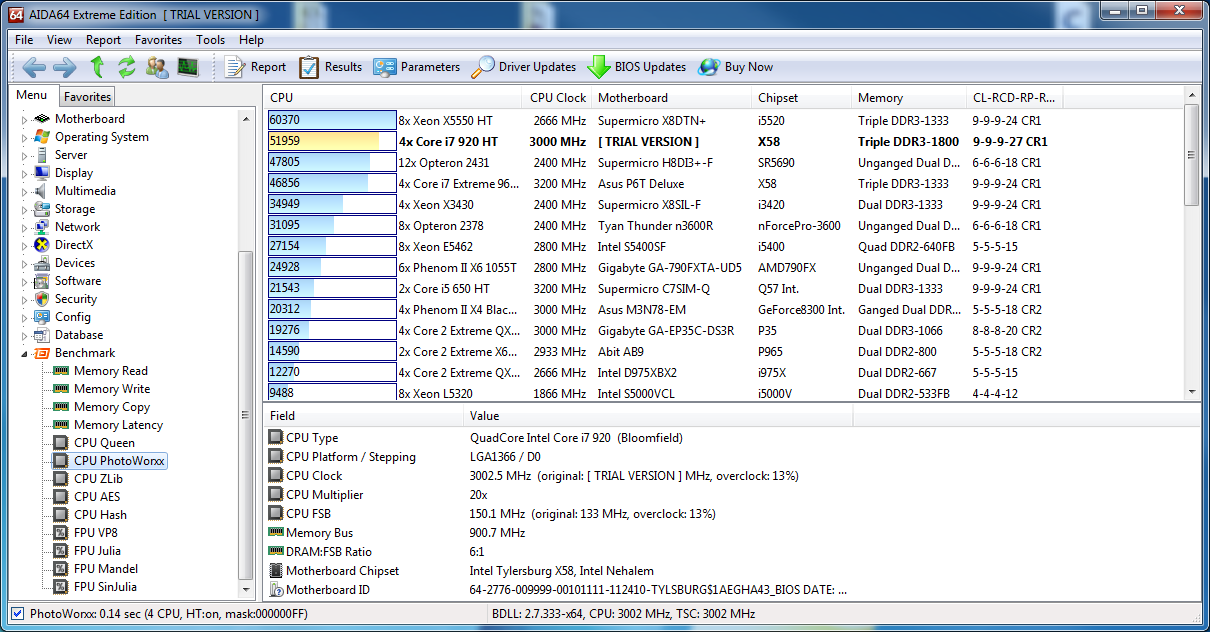
Photo Worxx
Much like the name suggests Photo Wrokxx benchmark evaluates performance based on operations on RGB photos. Better scores in this category would translate into better performance in things such as streaming media and photo applications. The test system performed rather well in this benchmark coming in second in both overclock and at the XMP profile at 59K each.
 |
 |
| Default XMP – 920 @ 3.0 GHz RAM @ 1800 MHz |
Overclock: 920 @ 3.6 GHz RAM @ 1800 GHz |
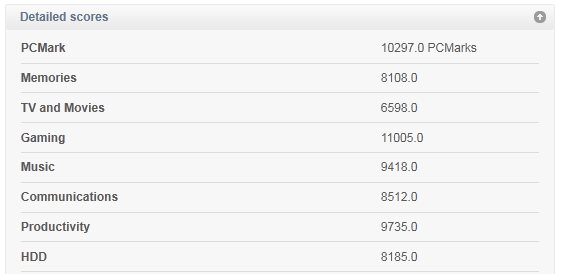
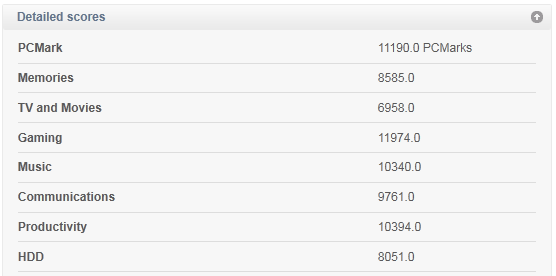
PC Mark Vantage
The overall system score generated by PCMark vantage for the Default XMP profile clocked and the CPU clocked at 3.0 GHz was 10297 PCMarks which is impressive considering I was still running a single 4870 and traditional drives. The hard and the memories suites produced the lowest scores of all coming in the 8000’s range. The main benefit of the overclock in this benchmark was demonstrated mainly in Gaming, Communication and Music suites where the scores jumped by almost 1000 points and thereby producing an overall score of 11190 PCMarks. The Memories suit also improved by ~500 points despite having the RAM clocked at a lower speed.
 |
 |
| Default XMP – 920 @ 3.0 GHz RAM @ 1800 MHz |
Overclock: 920 @ 3.6 GHz RAM @ 1600 GHz |

[…] Sapphire Pure Black x58 @ TechwareLabs […]
[…] Sappahire Pure Black x58 Motherboard @ Techwarelabs Foxconn H55MX-S Motherboard Review @ […]