FurMark
“FurMark is a very intensive OpenGL benchmark that uses fur rendering algorithms to measure the performance of the graphics card. Fur rendering is especially adapted to overheat the GPU and that’s why FurMark is also a perfect stability and stress test tool (also called GPU burner) for the graphics card.”
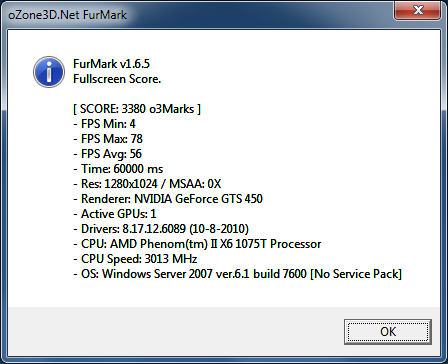
FurMark is OpenGL and in the world of gaming is not to common. However, it is common for 3D modeling. The scores seem pretty good with an average FPS of 56, but this card really isn’t intended for the OpenGL crowd, at least not those serious about it.
Cinebench 10
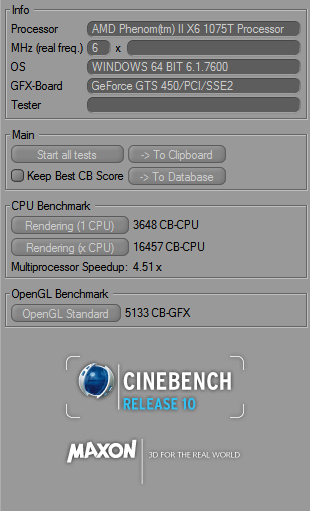 MAXON CINEBENCH runs several tests on a computer to measure the performance of the processor and graphics card under real-world circumstances and makes use of up to 16 cpus or cpu cores. Cinebench’s test process is in two-phases: The first test procedure is directed against the cpu using a 3D render scene and photo realistic image settings shown above to test how fast the cpu can produce the fully rendered scene. During the 1st pass of the test, the benchmark will only use one cpu, or in a multi-cpu core system it will use only a single cpu core to render the photo realistic scene to get a base value against which it will then perform the 2nd phase of the test using all of the cpu cores available. Higher Frames/Second and lower rendering time in seconds equals better performance.
Results
The GTS450 does great with a score of 5133. Remember, Cinebench is free, so test this against your GPU.
Cinebench 11.5
CINEBENCH is a real-world cross platform test suite that evaluates your computer’s performance capabilities. CINEBENCH is based on MAXON’s award-winning animation software CINEMA 4D, which is used extensively by studios and production houses worldwide for 3D content creation. MAXON software has been used in blockbuster movies such as Spider-Man, Star Wars, The Chronicles of Narnia and many more.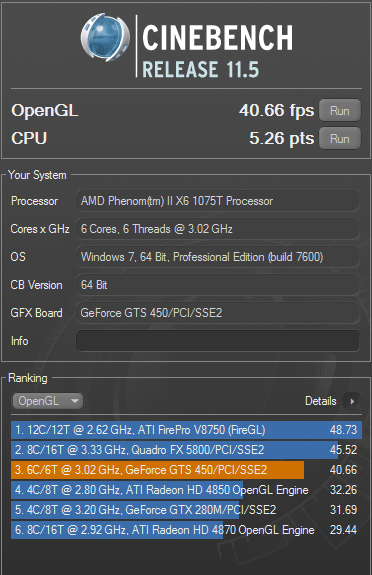
CINEBENCH is the perfect tool to compare CPU and graphics performance across various systems and platforms (Windows and Mac OS X). And best of all: It’s completely free.
Main Processor Performance (CPU)
The test scenario uses all of your system’s processing power to render a photorealistic 3D scene (from the viral “No Keyframes” animation by AixSponza). This scene makes use of various different algorithms to stress all available processor cores.
In fact, CINEBENCH can measure systems with up to 64 processor threads. The test scene contains approximately 2,000 objects containing more than 300,000 total polygons and uses sharp and blurred reflections, area lights and shadows, procedural shaders, antialiasing, and much more. The result is given in points (pts). The higher the number, the faster your processor.
Results
Here we have a much more understandable score of 40.66fps for the GTS 450. And according to Cinebench, it’s quite a bit faster than a Radeon HD 4850, and approaches a mystery Radeon 5800 Series card.

Those are some pretty impressive specs! I have never tried a Sparkle video card before, but I’ve heard great things about them recently so I might consider it in a couple months.
Your site info is really good..
This information is useful for me. Thanks for sharing.
What a great resource!