Cinebench 10

 MAXON CINEBENCH runs several tests on a computer to measure the performance of the processor and graphics card under real-world circumstances and makes use of up to 16 cpus or cpu cores. Cinebench’s test process is in two-phases: The first test procedure is directed against the cpu using a 3D render scene and photo realistic image settings shown above to test how fast the cpu can produce the fully rendered scene. During the 1st pass of the test, the benchmark will only use one cpu, or in a multi-cpu core system it will use only a single cpu core to render the photo realistic scene to get a base value against which it will then perform the 2nd phase of the test using all of the cpu cores available. Higher Frames/Second and lower rendering time in seconds equals better performance.
Results
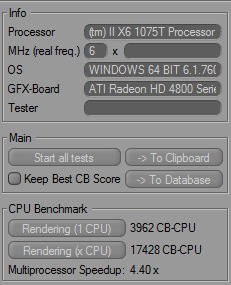
The Phenom II x6 1075T scored a remarkable 17428 points in the multi-CPU rendering test which is a 4.40x improvement over the single core result of 3962. Something different with this result is how far the speed up is from 6 times better. In the past when I’ve run this test, speedups were closer to the number of cores available.
Cinebench 11.5
CINEBENCH is a real-world cross platform test suite that evaluates your computer’s performance capabilities. CINEBENCH is based on MAXON’s award-winning animation software CINEMA 4D, which is used extensively by studios and production houses worldwide for 3D content creation. MAXON software has been used in blockbuster movies such as Spider-Man, Star Wars, The Chronicles of Narnia and many more.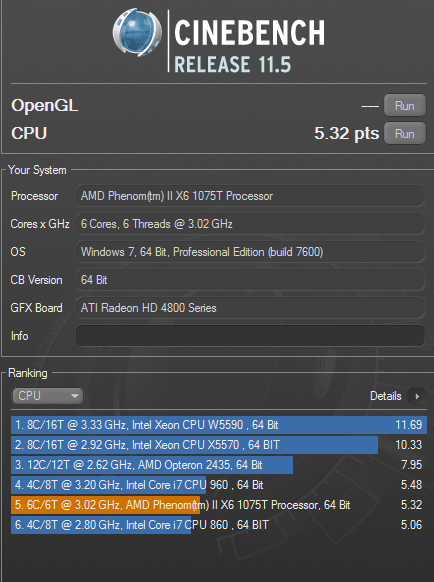
CINEBENCH is the perfect tool to compare CPU and graphics performance across various systems and platforms (Windows and Mac OS X). And best of all: It’s completely free.
Main Processor Performance (CPU)
The test scenario uses all of your system’s processing power to render a photorealistic 3D scene (from the viral “No Keyframes” animation by AixSponza). This scene makes use of various different algorithms to stress all available processor cores.
In fact, CINEBENCH can measure systems with up to 64 processor threads. The test scene contains approximately 2,000 objects containing more than 300,000 total polygons and uses sharp and blurred reflections, area lights and shadows, procedural shaders, antialiasing, and much more. The result is given in points (pts). The higher the number, the faster your processor.
Results
Some great numbers showing with this test. The addition of processor comparisons to Cinebench 11 is very welcome. Now we can see that the 1075T scored very close to an i7 960 with a score of 5.32. Impressive numbers coming from AMD.

[…] & X4 970 BE & X2 560 BE Processor Review @ EOC AMD Processor Reviews @ Hi Tech Legion AMD Phenom II x6 1075T 3.0GHz Processor @ TechwareLabs AMD Phenom II X6 1075T Black Edition @ OC3D AMD CPU Refresh: 5 New Phenom II & […]