Benchmark Results:
Below are some of the benchmarking results we achieved when testing our system. The HERO remained stable throughout all of the tests without any problems. We choose the tests that we thought would be the most useful in terms of testing the hero’s stability and performance when pushing our system to it’s limits. The MAXIMUS VII HERO achieved a higher overclock than most of it’s competitors and allowed us to get the most out of the 4790K.
3D Mark
 |
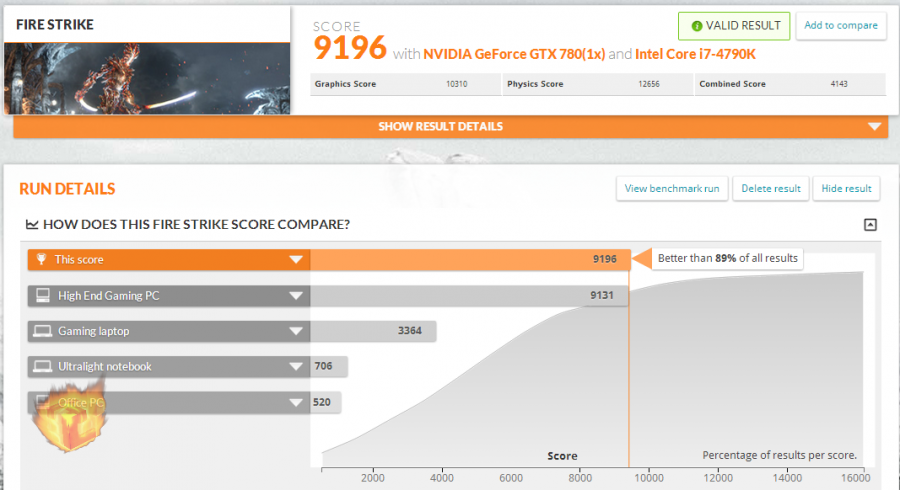 |
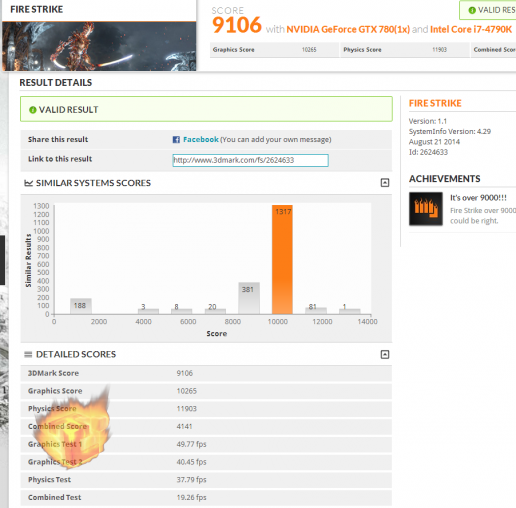
3DMark pushes your graphics card and CPU to the limits. This is one of the best tests out there for pure CPU gaming performance, and is perfect for the gaming system that we are testing. For this this review we used the Fire Strike test, which is more than capable of showing us how well our computer handles getting thrown in the fire. The MAXIMUS VII HERO remained stable and allowed us to push our cpu to the limits. We scored in the top 11% of system’s ever tested, which is a very respectable result.
PCmark8
 |
 |
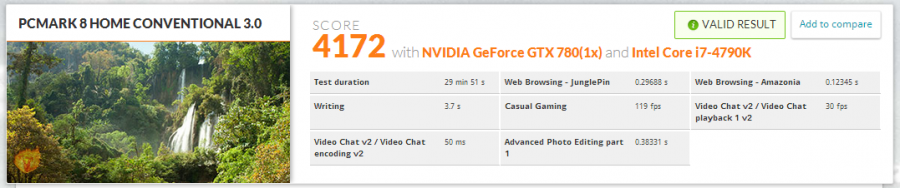
PCMark8 is another full system test, but focuses a little more on the CPU and memory portion of the system. We first tested our system at stock and scored a 4172, which is higher than 89% of all systems ever tested. The stock results were very impressive, but when we received the overclocked results, putting us in the top 2% of all systems with a score of 4512, we couldn’t have been more pleased. That’s the kind of performance you want to see.
PCmark7
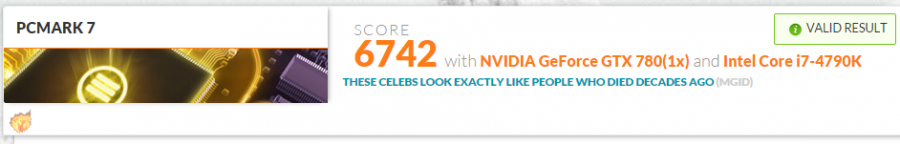 |
PCMark7 much like PCmark8 is a full system test and includes more than 25 individual workloads combined into 7 separate tests to give different views of system performance. We scored a 6742 which we couldn’t be happier with.
SiSoft Sandra
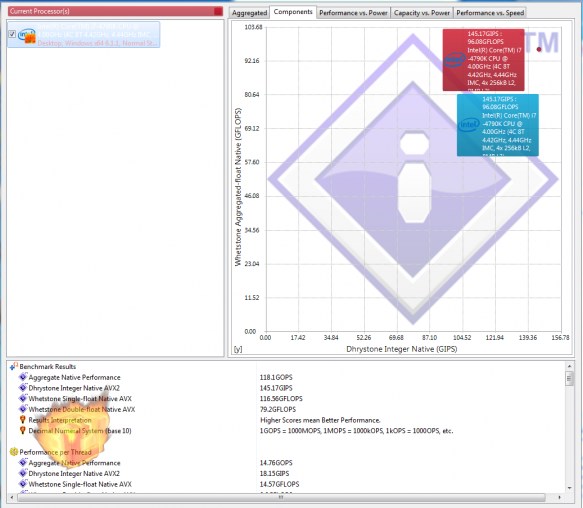 |
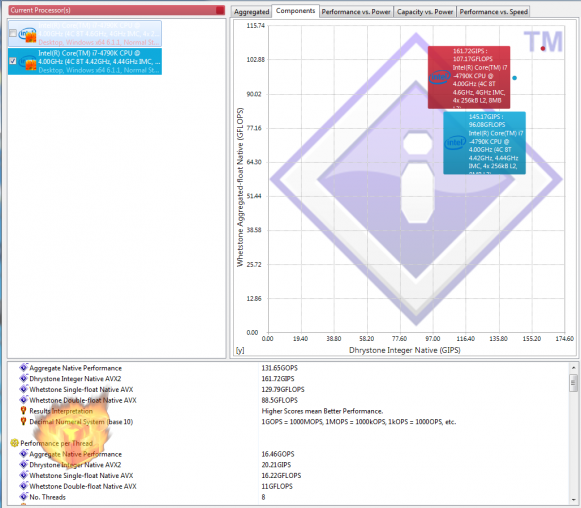 |
With SiSoft Sandra, you’re able to test almost every component of your system. With the 4790K we pulled 145.2 GIPS and 96 GFLOPS at stock, and 161.7 GIPS with 107.2 GFLOPS after applying our overclock. The MAXIMUS VII HERO allowed us to push the 4790K to front of the line for Quad-Core Processors with our overclock.