
Testing:
Installing the drive was a breeze. For testing I will leave the drive as a data drive.
Test Rig:
- Motherboard: MSI Z68A-GD65G3
- Processor: Intel i7-2600k
- Ram: Patriot 8GB DDR3 Viper Xtreme
- OS Drive: Samsung 850 Evo
The Benchmarks:
Synthetic Benchmarks are great because they will give you an “apples to apples” comparison oh how two drives will behave in a given system. Synthetic benchmarks are awful because they give you a point in time comparison of a device with a potentially non-realistic workload. To highlight how subjective some of the benchmarks can be I ran two sets of tests for each benchmark. For each test below, on the left I have benchmarks run while some data and workload had been performed on the drive while on the right shows the performance after a fresh format and reload.
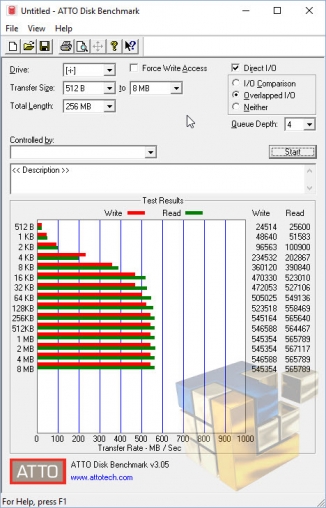
Atto is always a great way to get the manufacturers numbers. This benchmark provides the most favorable results.
 |
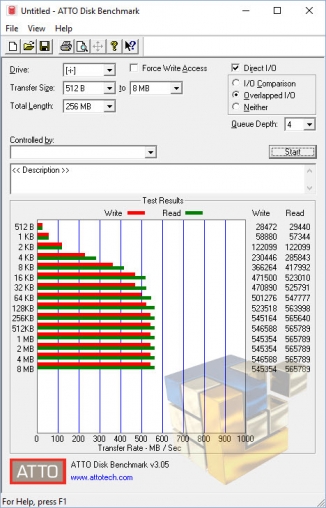 |
We hit all of the manufacturer’s numbers here. (not a big shocker, they test with the same utilities)
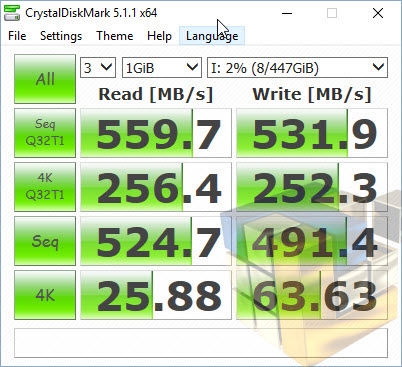
Crystal disk mark is a bit more intensive. The four tests it runs here are very different so you can see the spectrum of some sample workloads:
 |
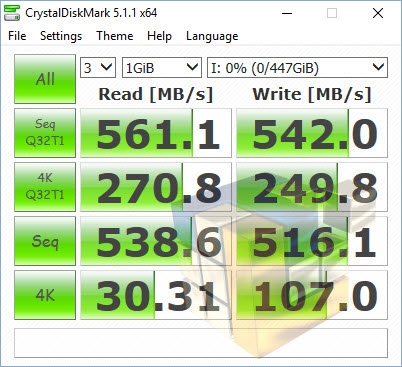 |
Sequential numbers are very close to what the manufacturer boasts here, but the 4k results are lackluster.
AS SSD is the toughest benchmark around for SSD’s. The data in this test is All non-compressible. The output shown below is in MB/s on the top and IOPS on the bottom.
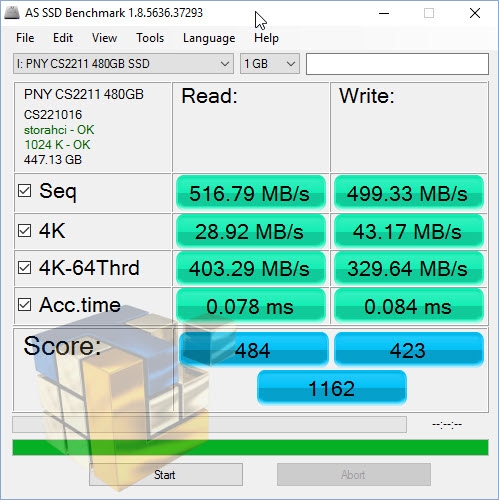 |
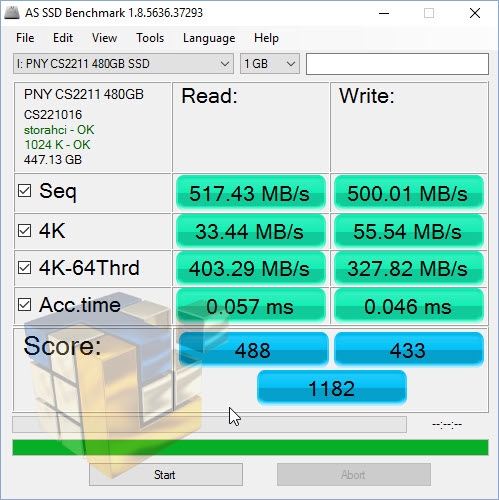 |
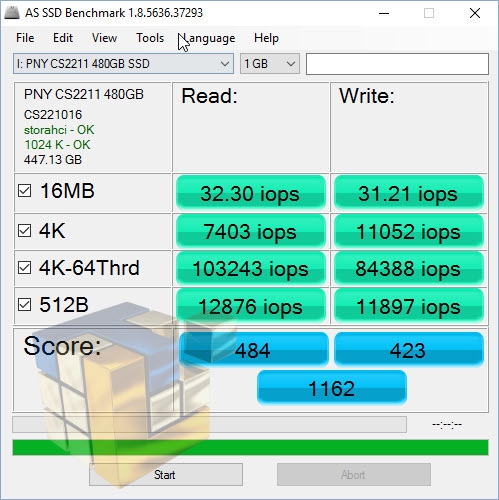 |
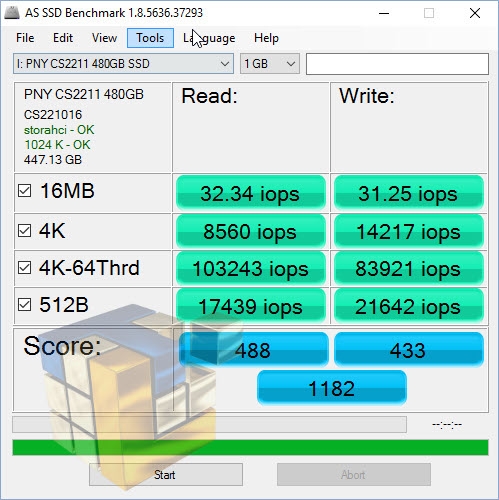 |
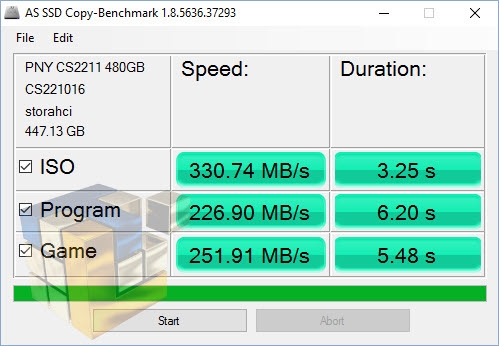
AS SSD also offers copy and compression benchmarks shown below. I only ran these tests on the clean wipe.
 |
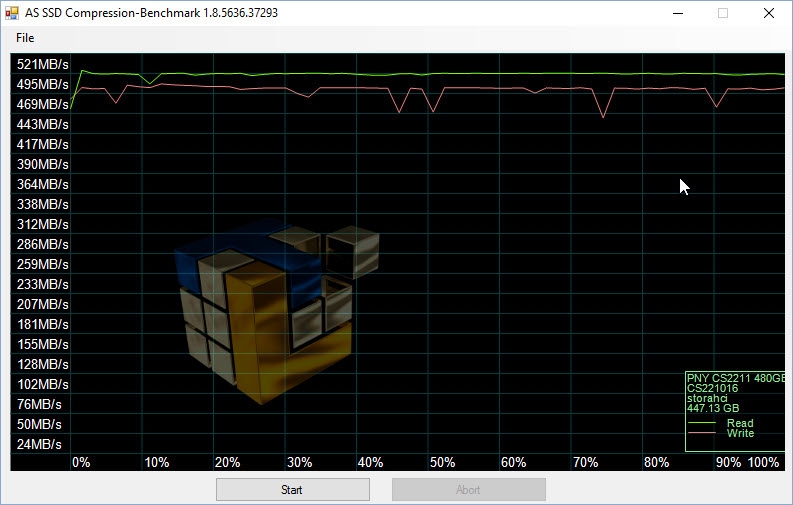 |
Though these numbers are lower than the previous two tests, the type of data makes these strong results.