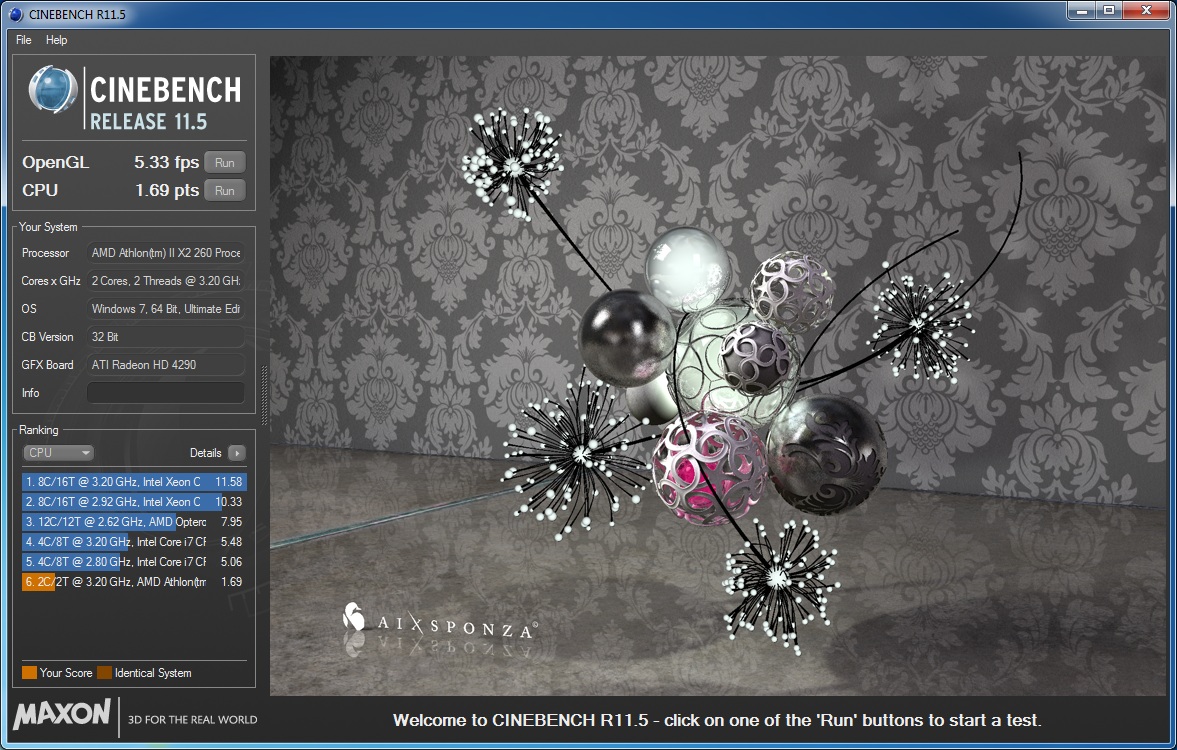
Cinebench:
Cinebench is a programs that tests the CPU by rendering out a 3D scene and measuring how long it takes to complete the task.
 |
 |
||
| Athlon II X2 255 | Athlon II X2 260 |
We can see that the 255 scored .75 points while the 260 scored 1.69 points. What’s also interesting is that the OpenGL score is higher in the 260’s test. The 255 may have been a slight bottleneck for the onboard Radeon 4290.
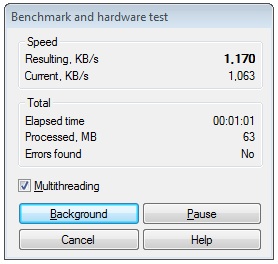
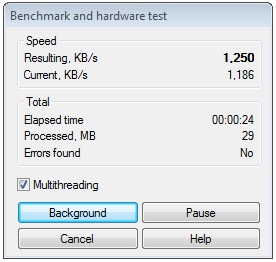
WinRAR:
The archiving program WinRAR has a built in benchmark tool to determine how quickly a a CPU can compress data.
 |
 |
||
| Athlon II X2 255 | Athlon II X2 260 |
The 255 comes in at 1170 KB/s while the 260 attains 1250 KB/s, owing the victory to its slightly faster clock speed.
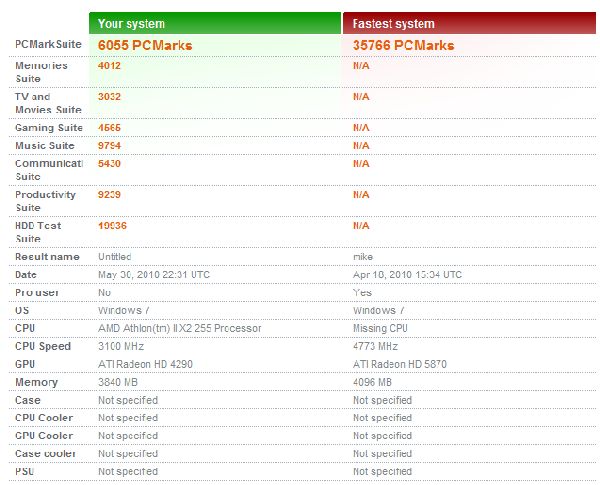
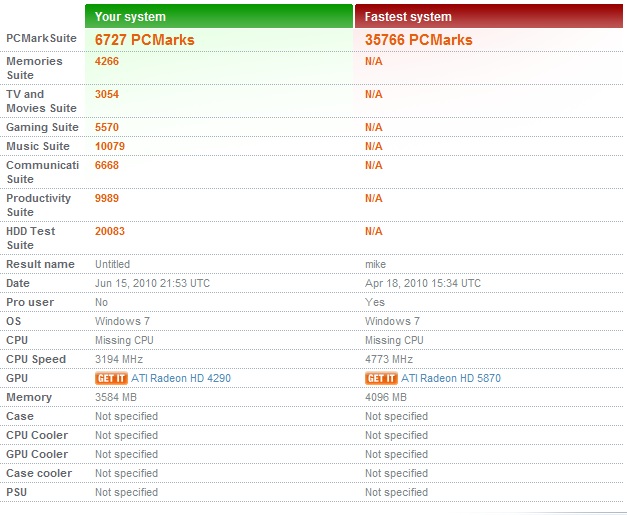
PC Mark Vantage:
PC Mark is made by the same creators of 3D Mark. While 3D Mark focuses more on potential gaming ability, PC Mark focuses on overall system performance.
 |
 |
||
| Athlon II X2 255 | Athlon II X2 260 |
The 255 configuration scored and overall score of 6055 while the 260 scored a 6727. If you look at the sub-score of each, you can see how the change in clock speed affects all components of the test.

it was very interesting to read http://www.techwarelabs.com
I want to quote your post in my blog. It can?
And you et an account on Twitter?