Benchmarks – Stock 3.3Ghz (Turbo 3.7Ghz)
AIDA64 v1.50.1230
AIDA64 Extreme Edition is a streamlined Windows diagnostic and benchmarking software which provides a wide range of features to assist in overclocking, hardware error diagnosis, stress testing, and sensor monitoring. It has unique capabilities to assess the performance of the processor, system memory, and disk drives. For our purposes today, AIDA64 is able to test the limits of the CPU with a collection of tasks such as AES data encryption and gives us performance based on numbers. These numbers allow us to compare the Intel® 2nd Gen Core i5 2500K to other processors available on the market. The 5 CPU tests provided in AIDA64 are Queen, PhotoWorxx, ZLib, AES, and Hash.
 |
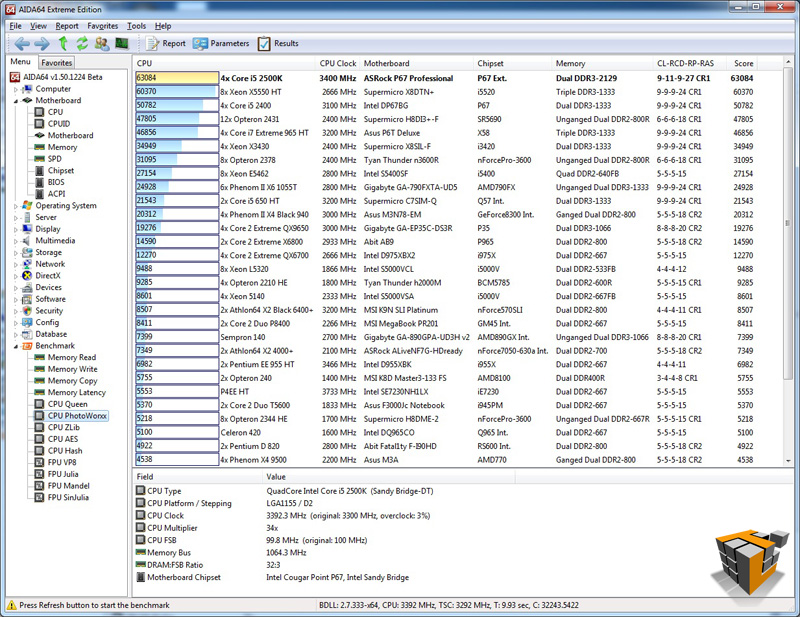 |
| CPU Queen – 5th | CPU PhotoWorxx – 1st |
 |
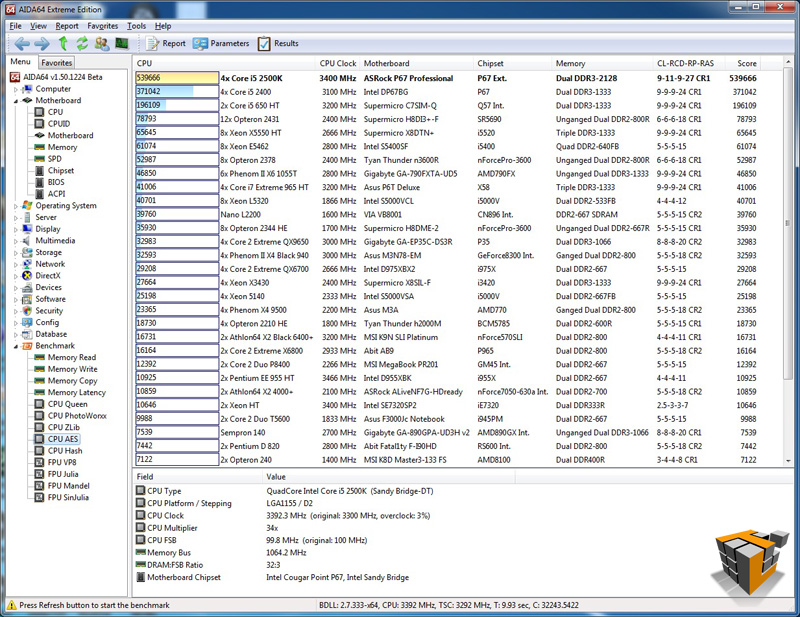 |
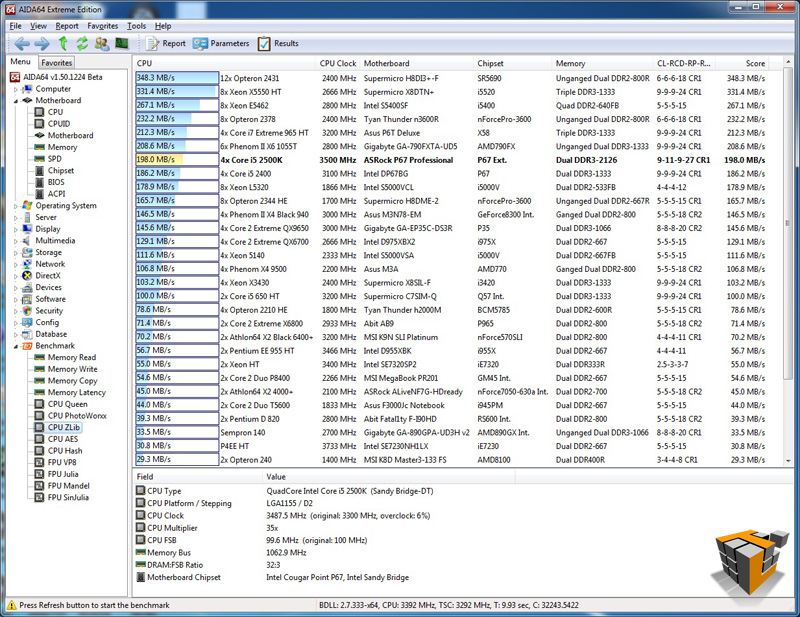
| CPU ZLib – 7th | CPU AES – 1st |
 |
|
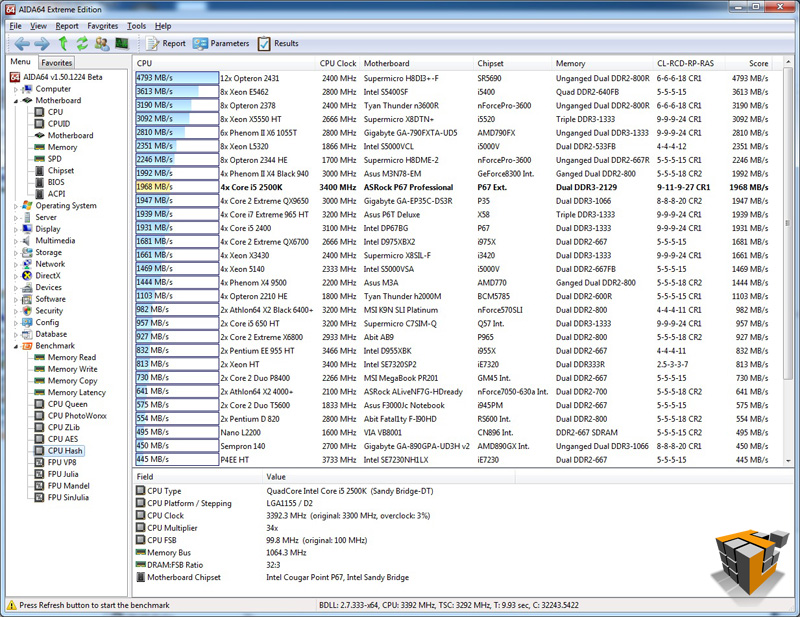
| CPU Hash – 9th | |
Excellent results all round proving the 2nd Gen Core i5 2500K CPU and ASRock Fatal1ty P67 Professional Motherboard are ready, willing, and able to perform all the number crunching, compression, and imagery tasks on demand. Maybe with some overclocking we would see 1st place in all 5 tests?
PCMark Vantage x64
This benchmark is a series of tests requiring the CPU, memory sub system, caches, GPU and more.
A PCMark score is a measure of your computer’s performance across a variety of common tasks such as viewing and editing photos, video, music and other media, gaming, communications, productivity and security. From desktops and laptops to workstations and gaming rigs, by comparing your PCMark Vantage score with other similar systems you can find the hardware and software bottlenecks that stop you getting more from your PC.
 |
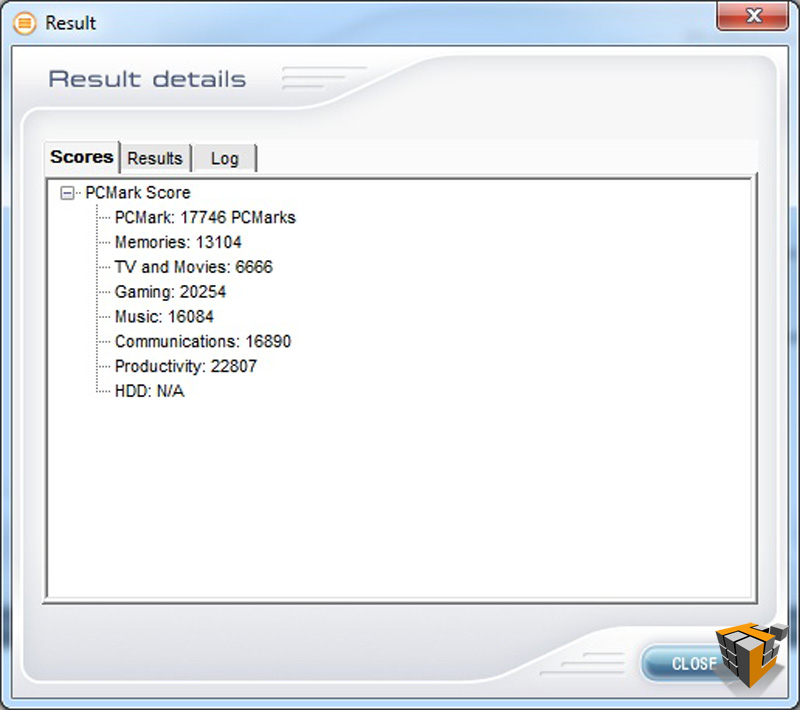 |
| How the test was setup to run | Results – 17746 Marks |
Another successful PASS for the 2500K & ASRock board. The results of PCMark Vantage are incredibly useful when comparing systems and also comparing overclocking performance increase as we will see later on…
PerformanceTest v7.0
Another performance benchmark suite in our arsenal is PerformanceTest from PassMark. PassMark PerformanceTest allows you to objectively benchmark a PC using a variety of different speed tests and compare the results to other computers. We will use this suite to show the performance of the i5 2500K versus existing Core family processors. This benchmark will also provide a clear indication of performance increases gained from overclocking later in this article.
 |
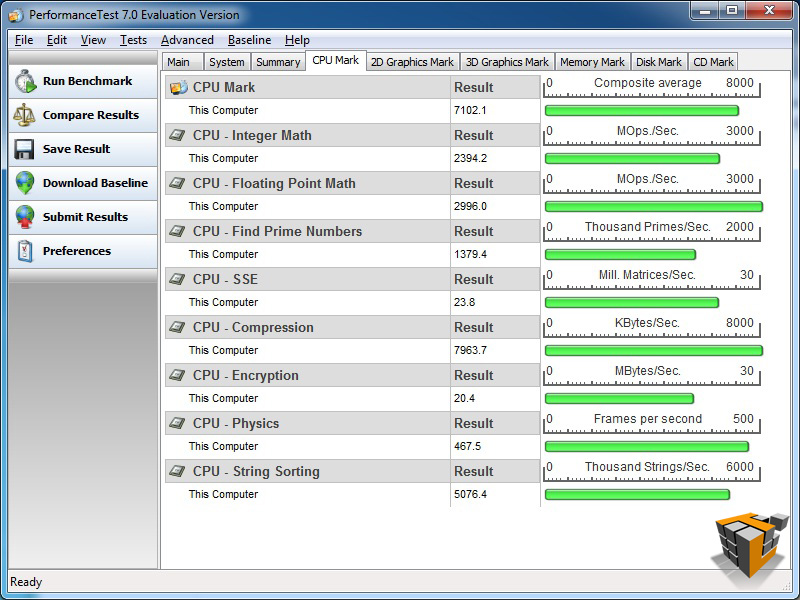 |
| PassMark Rating- 2635.9 | CPU Rating – 7102 |
 |
|
|
Detailed CPU comparison to i5 650, i5 760, and i7 920 The Core i5 2500K is in green |
|
Again the 2500K and Fatal1ty motherboard rock the show with strong results.
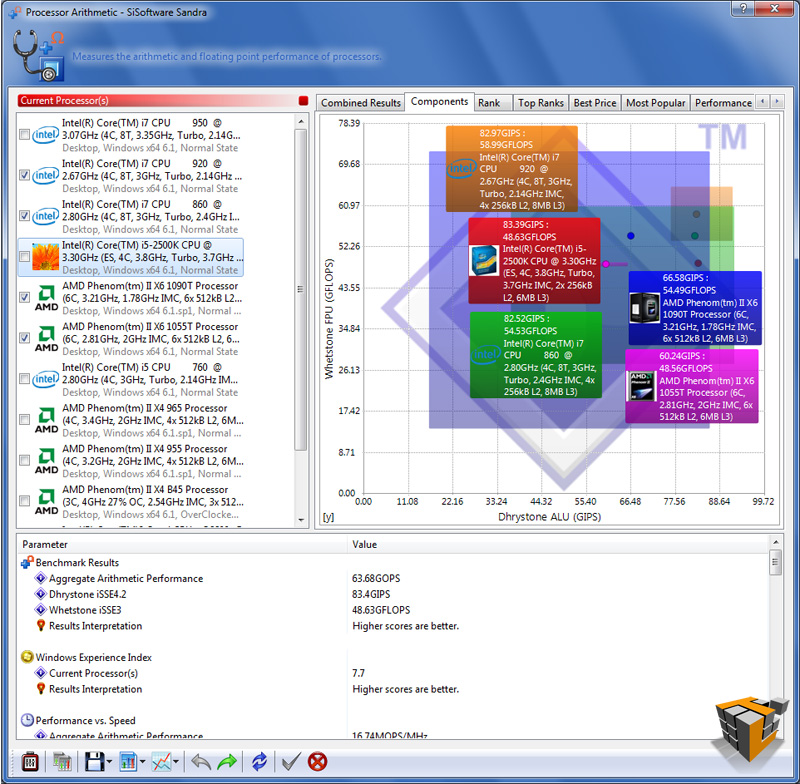
SiSoftware Sandra 2011c
The Sandra suite give us a more detailed look at the processor performance in particular areas of interest. There are 5 processor benchmarks of interest for our purposes today.
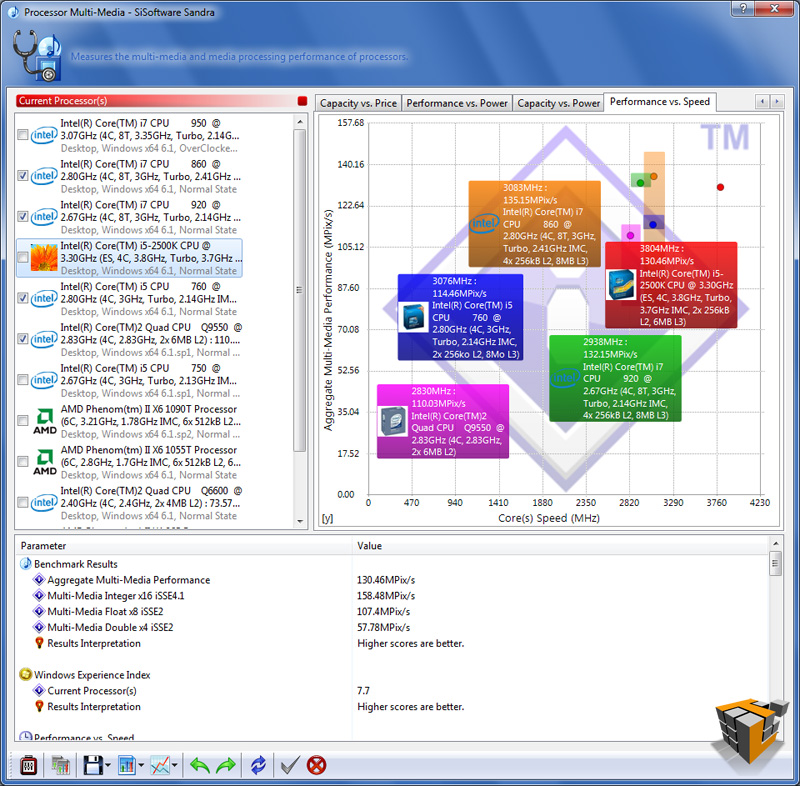
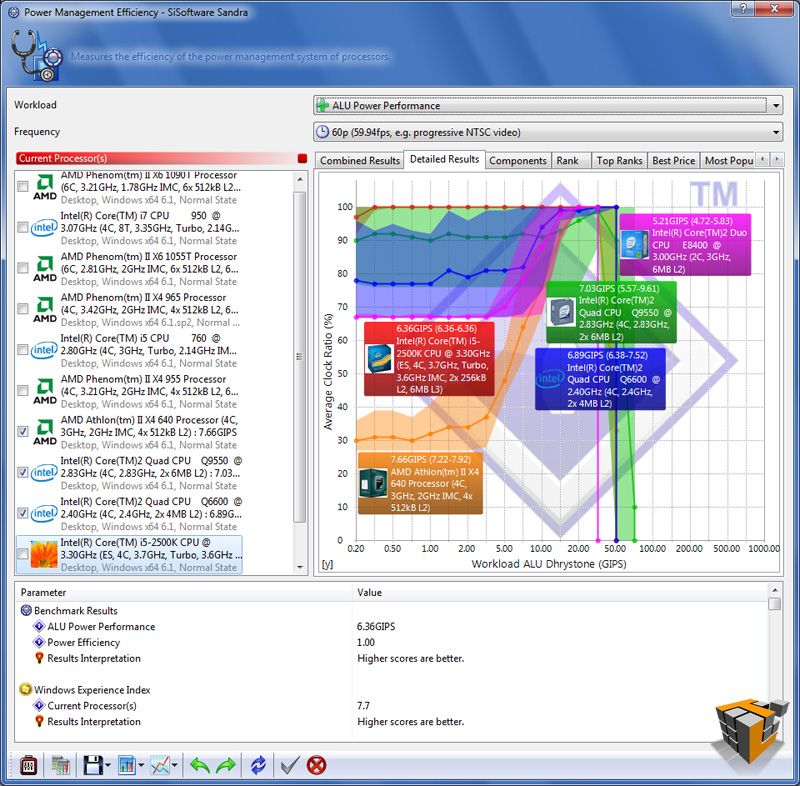
The table below has 5 rows, 1 for each test; each row has 3 graphs. The left graph is the combined result, the center graph compares the 2 components tested, the last right chart is ‘Performance vs Speed’ best results of this graph are furthest to the right and nearest the top of the chart.
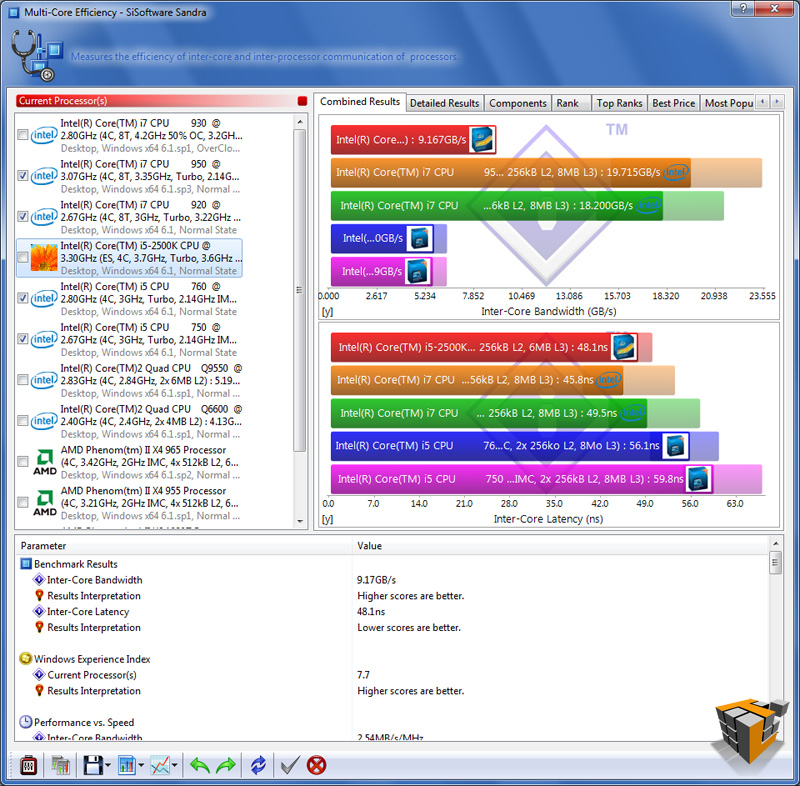
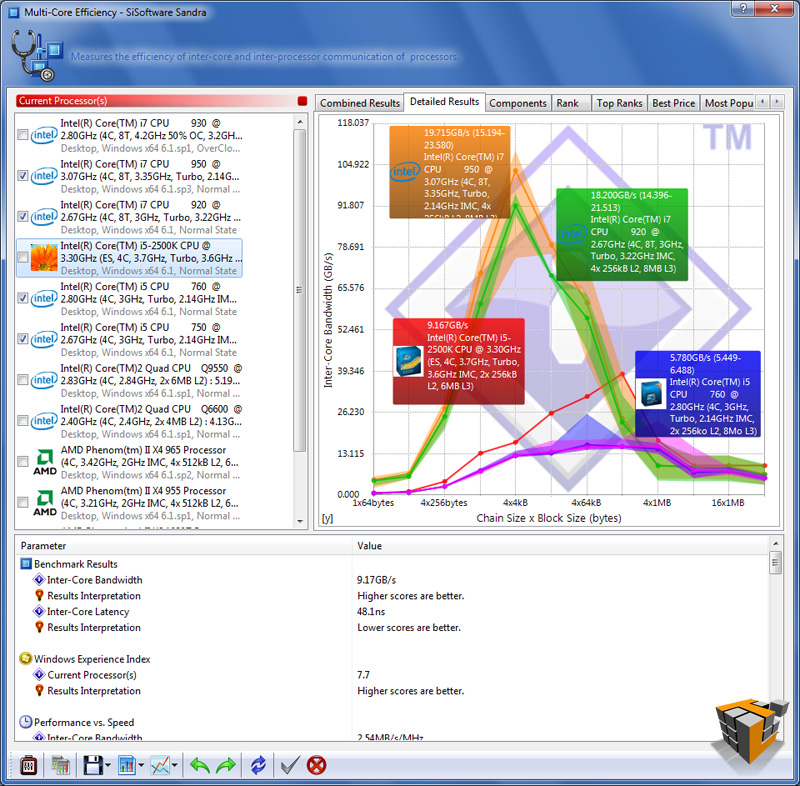
Overall the results translate as follows: higher results or longer bars equal better performance, with the exception of the Multi-Core Efficiency latency test in row 3 highlight in orange (bottom half of the image labeled ‘Inter-Core Efficiency’).
Processor Arithmetic: Benchmarks the ALU and FPU processor units. Shows how your processors handle arithmetic and floating point instructions in comparison to other typical processors.
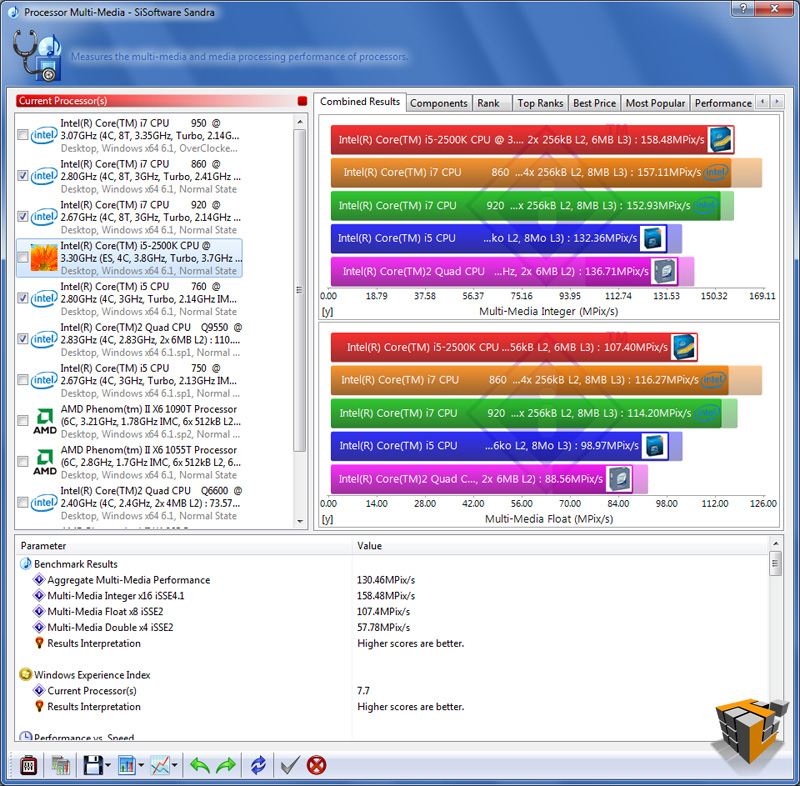
Processor Multi-Media: Benchmark the SIMD processor units. Shows how your processors handle multi-media instructions and data in comparison to other typical processors.
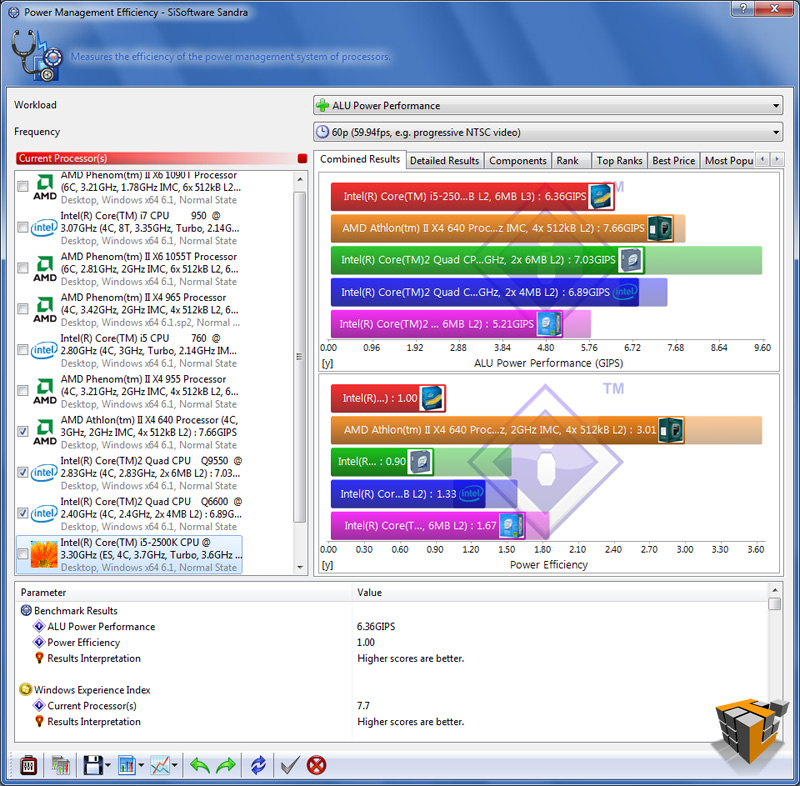
Power Management Efficiency: Benchmark the power management efficiency of the processors. Shows how efficient the power management of your processors is in comparison to other typical processors.The ability of the processors to step-down in frequency and voltage at different workloads is measured. The more a processor steps down in both frequency and voltage the better the score at the specific workload. The test stops when the workload is too great the processor even at 100% efficiency.
Multi-Core Efficiency: Benchmark the multi-core efficiency of the processors. Shows how efficient the processor cores and their inter-connects are in comparison to other types to other typical processors. The ability of the cores to process data blocks and pass them to another core for processing (producer-consumer paradigm) of different sizes and different chain sizes is measured. The efficiency of the inter-connect between cores is thus benchmarked; however, the number of cores (and processors) also counts as more data buffers can be processed simultaneously (aka “in flight”).
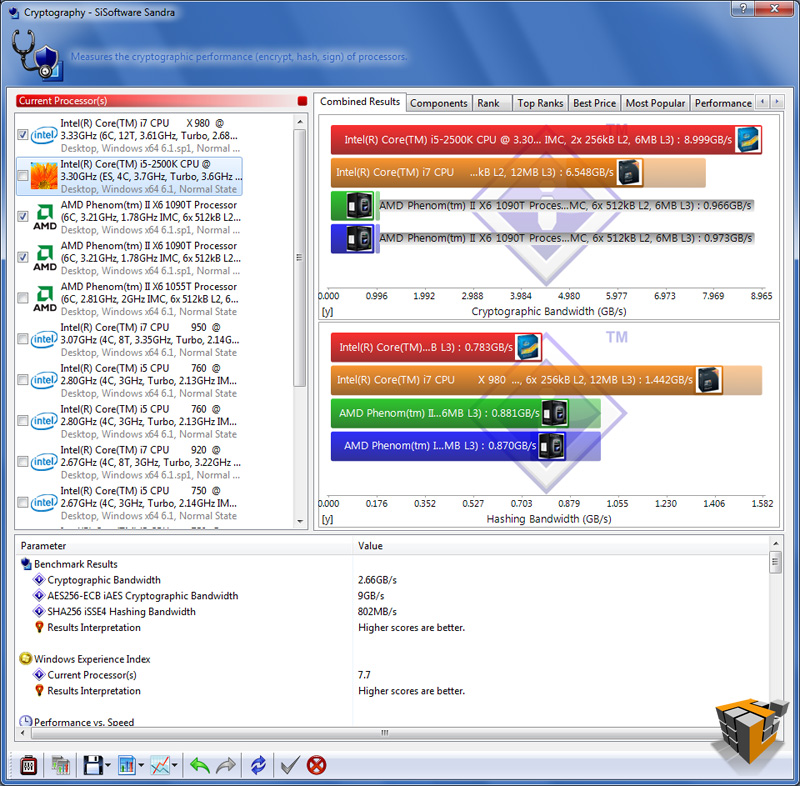
Cryptography: Measures the cryptography efficiency of the processor units: encryption, decryption and hashing. Shows how your processors handle cryptographic operations in comparison to other typical processors.
 |
 |
 |
| Processor Arithmetic | ||
 |
 |
 |
| Processor Multi-Media | ||
 |
 |
 |
| Multi-Core Efficiency | ||
 |
 |
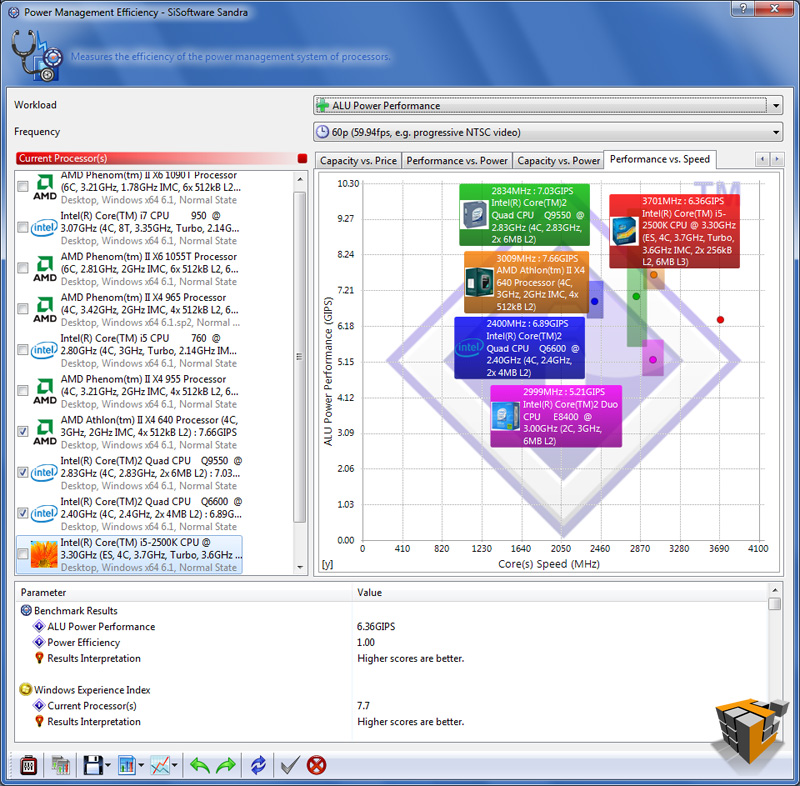 |
| Power Management Efficiency | ||
 |
 |
 |
| Cryptography | ||

[…] ASRock Fatal1ty P67 Professional Motherboard @ TechwareLabs […]
[…] don't take our word for it, come check out the full review and benchmarks and decide for yourself…http://www.techwarelabs.com/asrock-fatal1ty-p67-professional-motherboardDiggLeave a Reply Click here to cancel reply. Name (required) Mail (will not be published) […]
[…] Sapphire Pure Black P67 Hydra Motherboard (PB-CI7S42P67) Review @ KitGuru ASRock Fatal1ty P67 Professional Motherboard @ TechwareLabs ASRock Fatal1ty P67 Professional (Intel P67 Express) Motherboard Review @ TweakTown […]