Introduction
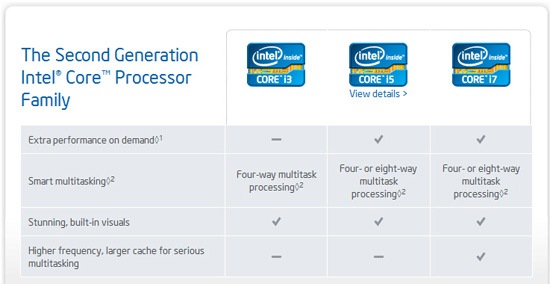
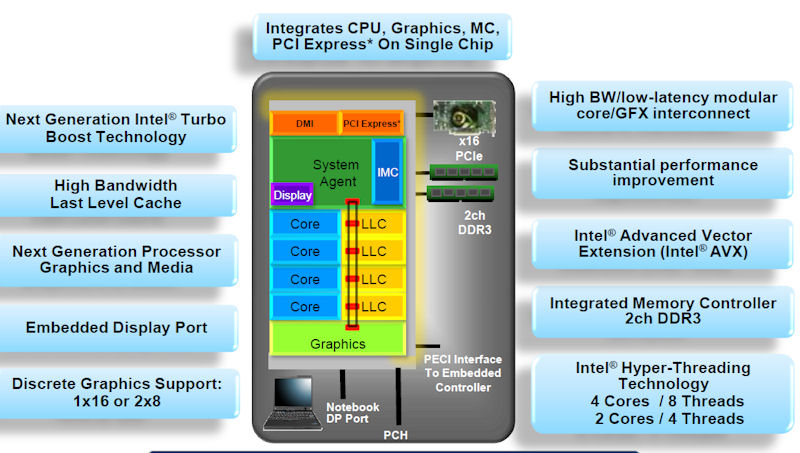
The Second Generation of the Intel Core Processor Family took off this past January with many early adopters pleasantly surprised by the abundance of speed, updated technologies, and better graphics integration. The high-end option in the 2nd Gen family is the beastly Core i7-2600K. The i7-2600K takes on all the features of the 2nd Gen i5 series with 1 major addition to the specifications – Intel Hyper-Threading Technology. For a rundown of Sandy Bridge and the i5-2500K CPU, check out our earlier in depth review of the 2500K. Here is a quick recap of the 2nd Gen i5/i7 series major enhancements. Turbo Boost 2.0 providing extra processor power on demand by upping the maximum frequency of the CPU. Integration of CPU and Intel 3000 Graphics with the same 32nm process for both.
Overview of the 2nd Gen Intel Cores Series codename ‘Sandy Bridge’
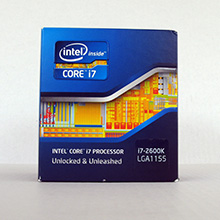
Today we have a sample of Intel’s 2nd Gen Core i7 2600K Sandy Bridge CPU, the K stands for ‘unlocked’ meaning overclocking is readily available on this model. With a stock clock of 3.40 Ghz, max turbo of 3.80 Ghz, 4 Cores, 8 Threads, and 8MB of Smart Cache the 2600K is the ultimate power house that promises to deliver consistent performance and an extra boost on demand. With the ability to achieve a stable over-clock of 4.80 Ghz under air, the i7-2600K is a piece of silicon mastery. Combine the nearly 5 Ghz clock speed with 4 cores and hyper threading to give you 8 threads… well you can easily justify the $100 price difference between the i5-2500K and i7-2600K.
<
Intel’s Take:
The Intel® Core™ i7 processor delivers best-in-class performance for the most demanding applications. This quad-core processor features 8-way multitasking capability and additional L3 cache. With adaptive performance and built-in visual capabilities this 2nd generation processor brings more intelligence to your PC.
2nd generation Intel® Core™ i7 processors feature Intel® Turbo Boost Technology 2.0 and Intel® Hyper-Threading Technology, enabling required security applications and protocols to run efficiently in the background without compromising productivity.
Today’s more visually sophisticated communication needs will be met with Intel® HD Graphics 3000 Technology, integrated into 2nd generation Intel Core processors. This eliminates the need for a discrete graphics card, reducing power consumption and system cost.
–~~~~~~~~~~~~–
2nd Gen Intel® Core Processor Family
Intel’s 2nd Generation of Core processors take the many successful aspects of existing Intel processor technology with the latest research and added benefits of many decades producing top notch processors. Advancements in GPU integration, memory controllers, turbo boost, and Smart Cache enables the 2nd Gen Core series to excel in all areas surpassing expectations. The i7-2600K is the ultimate smart performance processor providing ample power to perform flawlessly even under the highest load. Digital age computing brings resource intense tasks such as video rendering/encoding, photo editing, Blu-ray/HD/3D content creation, and encryption. Multitasking on the 2nd Gen core series is painless. Tasks such as HD video encoding would previously require a PC dedicate the major of its resources to the single task, leaving the PC unusable until the encoding was complete. With exclusive technologies such as Quick Sync built-in to the 2nd Gen series of processors complemented by features of the Sandy Bridge chipset a 2nd Gen core system will perform multi-tasking of even intense tasks with ease.
The 2nd Gen Intel Core processor family features new and improved technologies built in to the chip:
- Intel® Turbo Boost Technology 2.0 dynamically increases the processor frequency as needed by taking advantage of thermal and power headroom when operating below specified limits.
- Basically this feature enables the processor to clock up and down depending on demand, more power when you need it, less power to save battery when there is less demand.
- Intel® Smart Cache is dynamically allocated to each processor core based on workload, which significantly reduces latency and improves performance.
- Up to 8MB of shared smart cache
- More cache available on the fly translate to a faster overall experience
- Advanced Encryption Standard New Instructions add hardware acceleration to AES algorithms and speeds up the execution of AES applications.
- Dual Channel DDR3 Memory Support up to 32GB
- H67 chipset supports speeds of DDR3-1066/DDR3-1333 max
- P67 chipset supports speeds up to DDR3-1600, DDR3-1866, and DDR3-2133 max
- Max Memory Bandwidth 21 GB/s
- Intel® HD Graphics with Dynamic Frequency
- Full integration of GPU into the CPU, graphics and processor housed in the one chip
- Will provide a frequency boost increasing graphics performance on demand
- Provides power savings benefit when full-on graphics is not needed, mostly a laptop battery friendly feature
- Base graphics frequency of 850 MHz
- Integration of graphics into the CPU die with HDMI spec 1.4 featuring available stereoscopic 3D and next version of Intel Wireless Display technology WIDI v2.0
-
Dual Display Capable
- Intel® Clear Video HD Technology
- High Definition playback technology on board
-
Intel® Quick Sync Video Technology
- Intel GPU utilized to encode/decode video
- H67/Z68 chipset motherboards only
- Multi-channel bit streaming audio
- Enables professional-grade audio capabilities with multi-channel bit streaming support for Dolby* TrueHD and DTS* Premium Suite.
- Available Intel Advanced Technologies
- Intel Virtualization Technology (VT-x)
- Intel Active Management Technology 7.0 (AMT)
- Intel Trusted Execution Technology (TXT)
- Intel Streaming SIMD Extensions 4.1 (SSE4.1)
- Intel Streaming SIMD Extensions 4.2 (SSE4.2)
- Intel Hyper-Threading Technology (HT)
- Intel Advanced Vector Extensions (AVX)
- Intel 64 Architecture
- Execute Disable Bit
- Intel® Fast Memory Access
- Updated Graphics Memory Controller Hub (GMCH)
- Intel® Flex Memory Access
- Facilitates easier upgrades by allowing different memory sizes to be populated and remain in dual-channel mode
- Intel Socket LGA1155
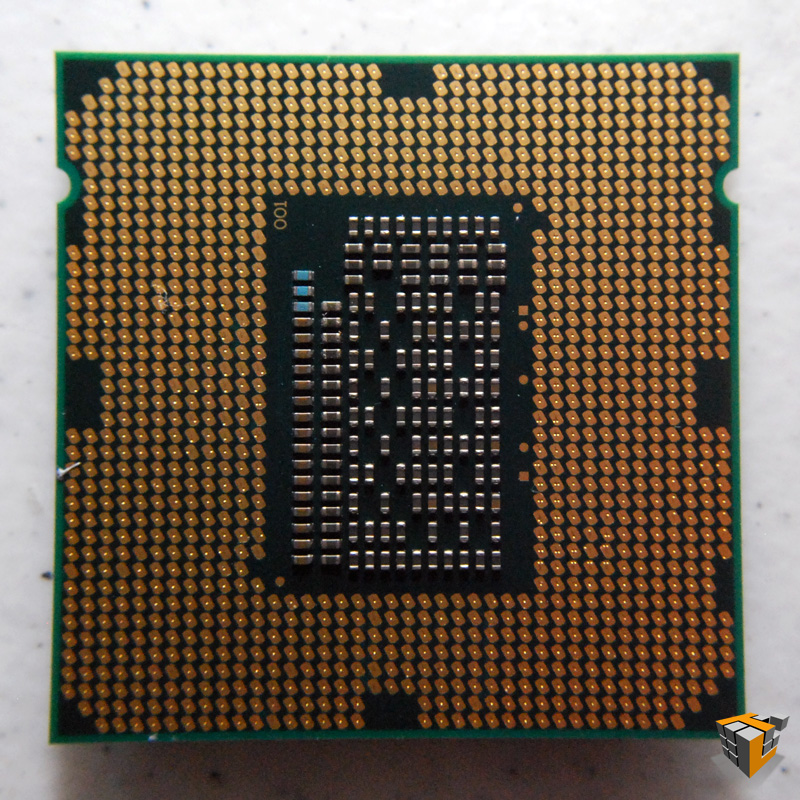
Closer Look
The processor we have for review today is the Intel® Core™ i7-2600K processor. It is a 4 core, 8 thread 32nm CPU with a stock speed of 3.40 Ghz featuring 8MB of L3 Smart Cache and a maximum Turbo frequency of 3.8 Ghz. Sharing the same silicon with the CPU is the integrated Intel HD Graphics with a base frequency of 850 Mhz with max dynamic frequency of 1.35GHz. The marriage of a high performance multi-core hyper-threading enabled CPU and Intel HD 3000 graphics exponentially increases performance.
 |
…. |  |
| . | ||
 |
…. | |
 |
||
 |
||
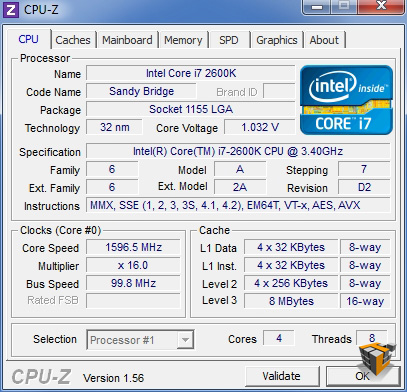
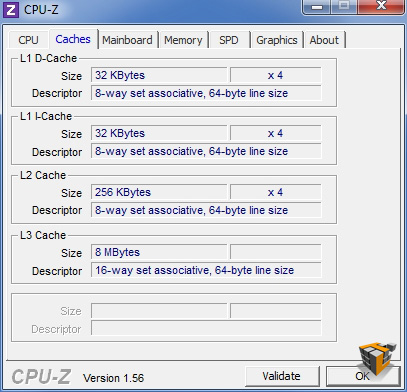
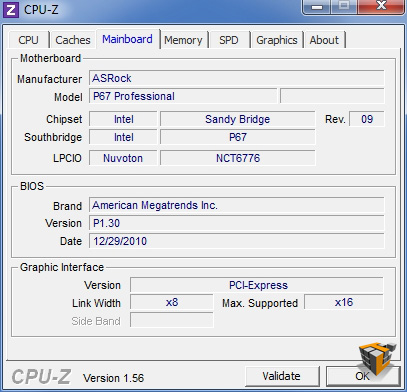
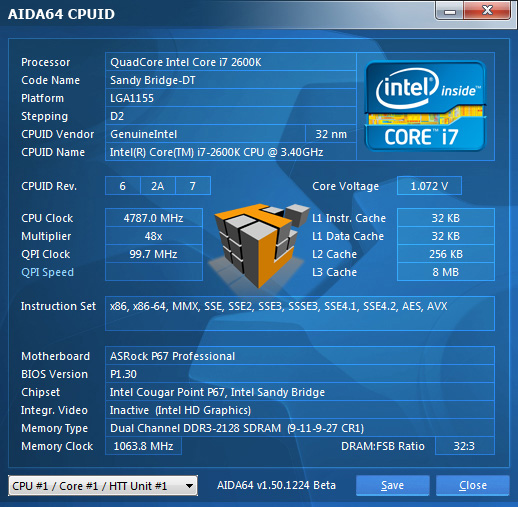
CPU-Z information showing Intel Core i7 2600K, cache specifications, and mainboard model.
Specifications
| Intel® Core™ i7-2600K Processor (8M Cache, 3.40 GHz) | |
| Status | Launched |
| Launch Date | Q1’11 |
| Processor Number | i7-2600K |
| # of Cores | 4 |
| # of Threads | 8 |
| Clock Speed | 3.40 GHz |
| Max Turbo Frequency | 3.80 GHz |
| Intel® Smart Cache | 8 MB |
| Bus/Core Ratio | 34 |
| Instruction Set | 64-bit |
| Instruction Set Extensions | SSE4.1/4.2, AVX |
| Embedded Options Available | No |
| Lithography | 32 nm |
| Max TDP | 95 W |
| Tray 1ku Budgetary Price | $317.00 |
| Memory Specifications | |
| Max Memory Size (dependent on memory type) |
32 GB |
| Memory Types | DDR3-1066/1333 + |
| # of Memory Channels | 2 |
| Max Memory Bandwidth | 21 GB/s |
| ECC Memory Supported | No |
The i7-2600K is very similar to its young brother the i5-2500K. A summary of the differences include:
- Larger Intel Smart Cache, 8 MB on this i7 compared to 6MB on the i5-2500K.
- Double the number of threads at 8 compares to the i5-2500K’s 4 threads.
- Both have the same 850 MHz Graphics Base Frequency, but the i7-2600K has a maximum dynamic frequency of 1.35 GHz.
- The i7-2600K features Intel® Hyper-Threading Technology, the i5-2500K does not.
- i7-2600K stock clock speed is 3.4 GHz with turbo up to 3.8 Ghz, the i5-2500K stock is 3.3 GHz with turbo up to 3.7 GHz.
- Price. The i7-2600K retails for $317 whereas the i5-2500K retails for $216
Test Setup
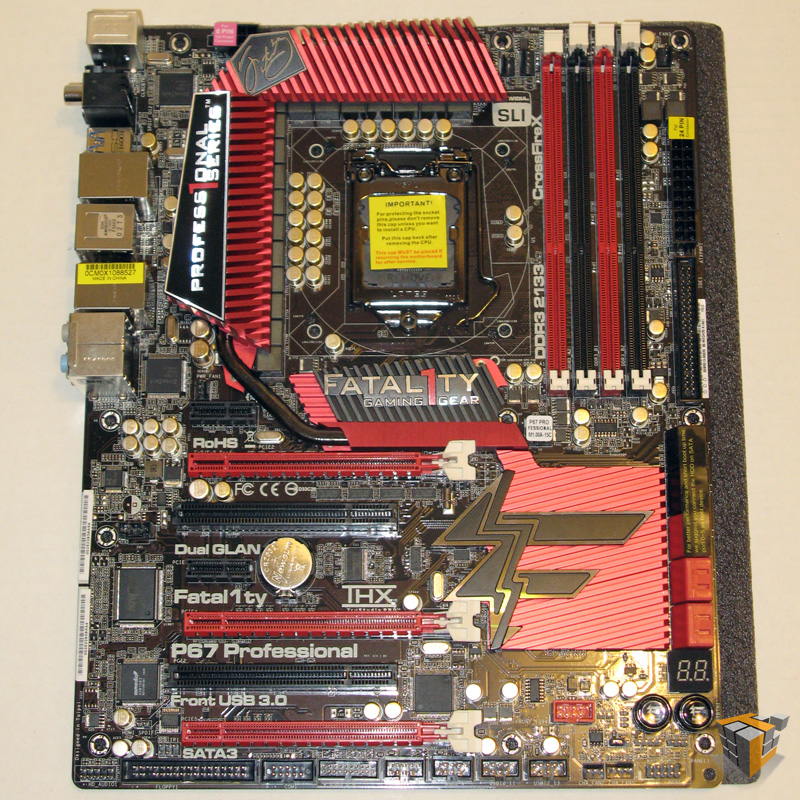
All tests were performed on the following system featuring the latest ASRock Fatal1ty P67 B3 Professional mainboard. This motherboard features the B3 Cougar Point revision, which corrects the issues discovered by Intel during production. The SATA III storage defect which caused wear out of the chipset, degrading performance, is resolved.
| CPU | Intel Core i7 2600K @ 3.4GHz |
| Heatsink | Thermalright Silver Arrow (Dual Fans) |
| Motherboard | ASRock P67 Professional B3 |
| Chipset | Intel® P67 Chipset |
| Graphics card | AMD ATI 6950 |
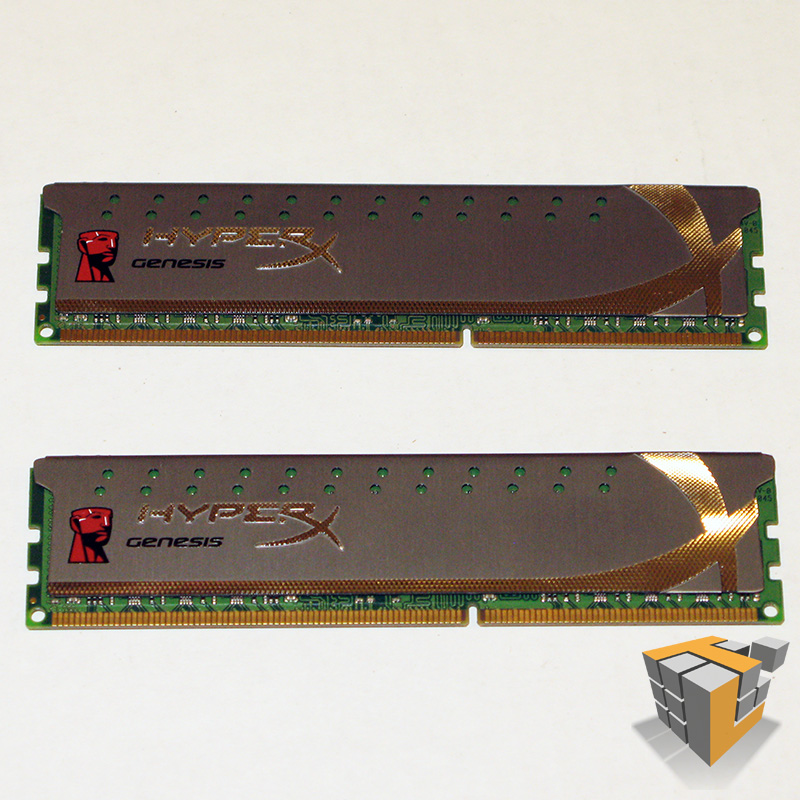
| RAM | 2x2GB Kingston DDR3-2133 , CL9 |
| Sound | Realtek ALC892 |
| SSD | 1TB Western Digital Caviar Black Edition |
| Power Supply | NZXT HALE90 80+Gold Class 750W |
| Case | Cooler Master HAF912 |
| OS | Windows 7 Ultimate |
| Drivers | Intel P67 Chipset 9.2.0.1021 ATI Catalyst 10.12 |
Pictures of Test Rig:
|
 |
 |
|
CPU Benchmarks
Now you’ve seen the specs lets get down to the number crunching, we need some numbers to prove that the 2nd Gen Core series is really bad ass on paper and on the bench! We rounded up our trusty collection of benchmark software that will stress the Core i5 2600K and give us some data which will will interpret into useful comparable information. Keep in mind the results provided individual benchmark software are synthetic and are only able to assess the relative performance of the given system. The results of each test should be considered a reasonable evaluation of performance, and are better used to compare the performance of different systems. The numbers produced by benchmarking do not prove the efficiency, speed, and power of the processor being tested; it is much more useful and preferred to compare the results from this processor to another make/model of processor to show the differences in efficiency, speed, and power.
The best benchmark suites provide baseline data and comparison data to allow us to present you with actual information instead of just numbers. Keep in mind that in some of the following tests lower numbers are better (for example latency, time to complete an operation, etc) and in some test higher numbers are better (MB/s, scores, GFLOPS, etc). But have no fear, we will guide you through the results and point out anomalies and interesting results. Todays testing will include the following benchmarking software: AIDA64 v1.50.1230, PCMark Vantage x64, PerformanceTest v7.0, and SiSoftware Sandra 2011c.
The Intel® Core i5 2600K is an unlocked processor meaning we can easily bump up the multiplier to squeeze more speed and power from the CPU. The ASRock Fatal1ty P67 B3 Professional motherboard is a prime candidate for overclocking our 2600K CPU. First all benchmarks will be run with the multiplier set to the default x34 which means the CPU will run at stock 3.40 Ghz (up to 3.80 Ghz turbo). This will be considered the baseline for later comparisons to over-clocked benchmarks
Benchmarks – Stock 3.40 Ghz
AIDA64 v1.50.1230
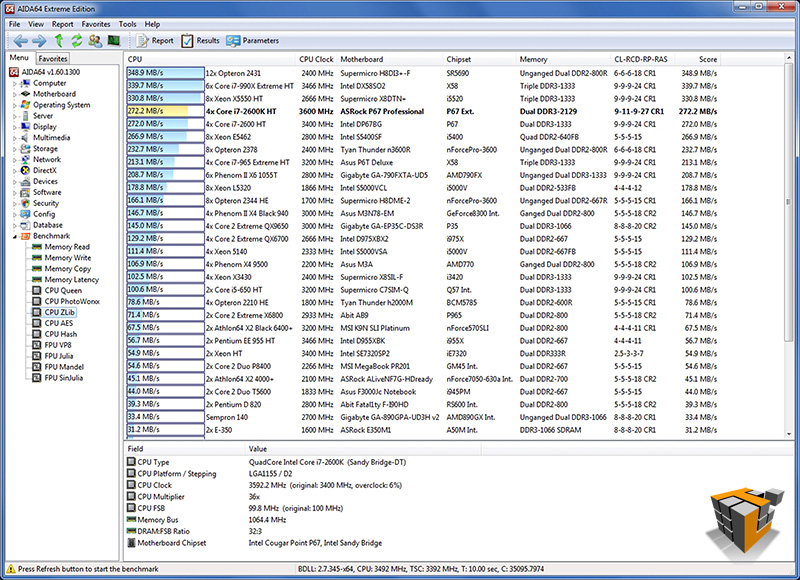
AIDA64 Extreme Edition is a streamlined Windows diagnostic and benchmarking software which provides a wide range of features to assist in overclocking, hardware error diagnosis, stress testing, and sensor monitoring. It has unique capabilities to assess the performance of the processor, system memory, and disk drives. For our purposes today, AIDA64 is able to test the limits of the CPU with a collection of tasks such as AES data encryption and gives us performance based on numbers. These numbers allow us to compare the Intel® 2nd Gen Core i5 2600K to other processors available on the market. The 5 CPU tests provided in AIDA64 are Queen, PhotoWorxx, ZLib, AES, and Hash.
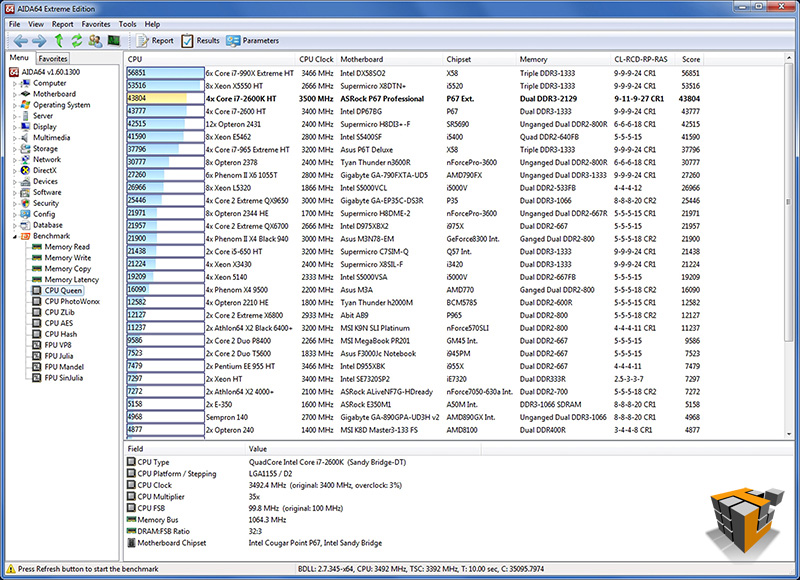
CPU Queen focuses on a chess related problem, solutions for the classic “Queens problem” on a 10 by 10 chessboard (more info here), using integer MMX, SSE2 and SSSE3 optimizations and focuses on the branch prediction capabilities and the misprediction penalties of the CPU. A CPU with the shorter pipeline and smaller amount of mispredictions will score higher. Basically this test is a number crunching math problem for the CPU.
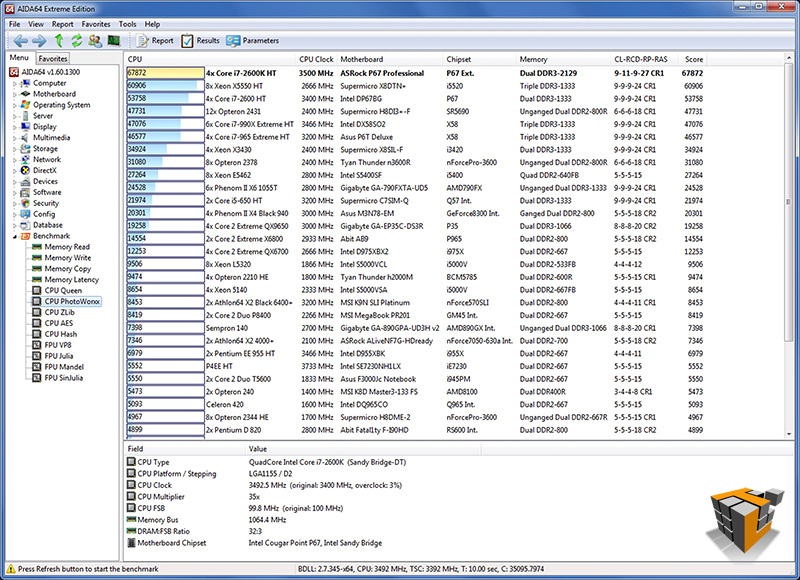
CPU PhotoWorxx performs the following tasks on a very large RGB image: fill, flip, rotate left, rotate right, random color fill, color to b&w, difference, and crop. These are common tasks used during digital photo processing. This benchmark stresses the integer arithmetic and multiplication execution units of the CPU and also the memory subsystem.
CPU ZLib is an integer benchmark which measures combined CPU and memory subsystem performance through the public ZLib compression library, a software library used for data compression.
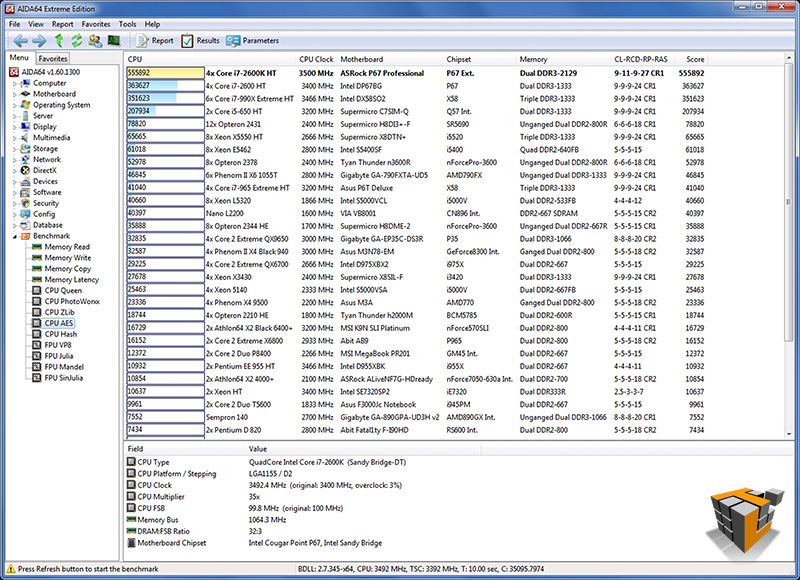
CPU AES is an integer benchmark measuring CPU performance using AES (Rijndael) data encryption. The 2600K should perform extremely well in this test due to hardware support and the New AES instruction set available in the Intel Core processors family.
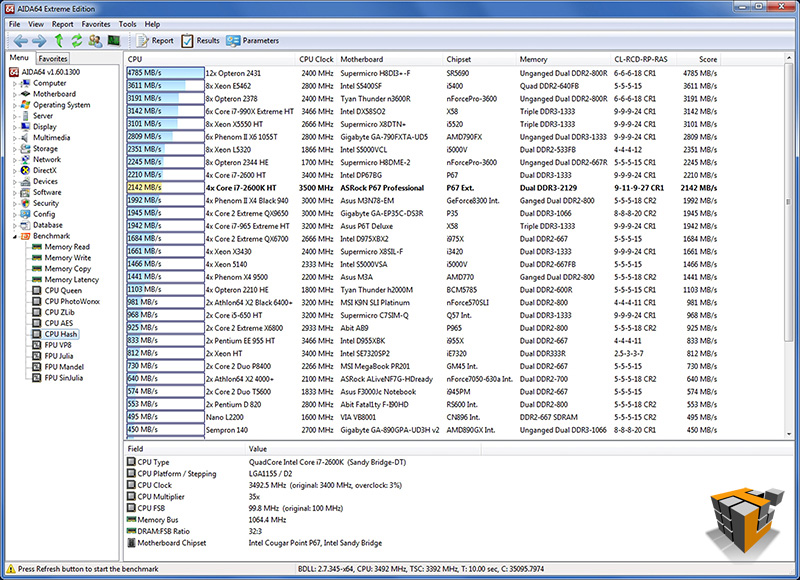
CPU Hash is another integer benchmark measuring CPU performance using the SHA1 hashing algorithm. The code behind this benchmark method is written in Assembly, and it is optimized for every popular AMD, Intel and VIA processor core variants by utilizing the appropriate MMX, MMX+/SSE, SSE2, SSSE3, or AVX instruction set extension. In this benchmark every thread is working on independent 8 KB data blocks, and the MMX, SSE2 and SSSE3 optimized calculation routines implement the latest vectorization idea of Intel.
 |
 |
| CPU Queen – 3rd
[2600K] 43804 vs 32083 [2500K] |
CPU PhotoWorxx – 1st
[2600K] 67872vs 63084 [2500K] |
 |
 |
| CPU ZLib – 4th
[2600K] 272.2 MB/s vs 198.0 MB/s [2500K] |
CPU AES – 1st
[2600K] 555892 vs 539666 [2500K] |
 |
|
| CPU Hash – 10th
[2600K] 2142 MB/s vs 1968MB/s [2500K] |
|
Excellent results all round proving the 2nd Gen Core i7 2600K CPU is ready, willing, and able to perform all the number crunching, compression, and imagery tasks on demand. Maybe with some overclocking we would see 1st place in all 5 tests?
PCMark Vantage x64
This benchmark is a series of tests requiring the CPU, memory sub system, caches, GPU and more.
A PCMark score is a measure of your computer’s performance across a variety of common tasks such as viewing and editing photos, video, music and other media, gaming, communications, productivity and security. From desktops and laptops to workstations and gaming rigs, by comparing your PCMark Vantage score with other similar systems you can find the hardware and software bottlenecks that stop you getting more from your PC.
At the time of testing we only had a P67 motherboard available so we won’t be testing the integrated GPU of the Intel 2nd Gen family, instead our stand-in the ATI 6950 will carry the load. The 2nd Gen series is aimed at visuals which are majorly supported by the GPU, but no GPU is worth its weight in silicon without a high performing CPU.
 |
 |
| How the test was setup to run | Results – 12220 Marks |
Another successful PASS for the 2600K. The results of PCMark Vantage are incredibly useful when comparing systems and also comparing over-clocking performance increase as we will see later on…
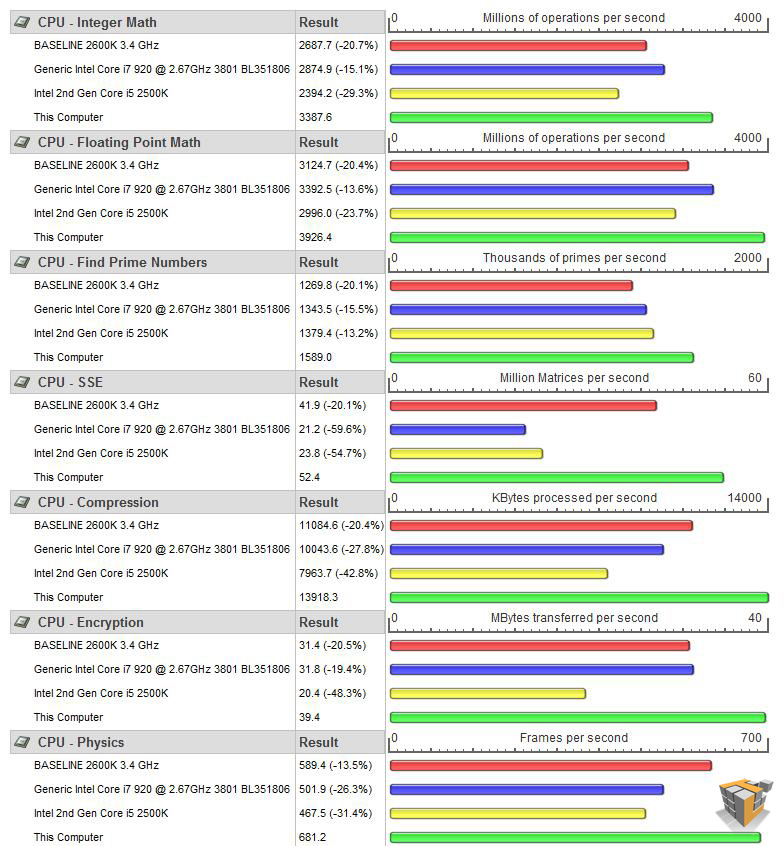
PerformanceTest v7.0
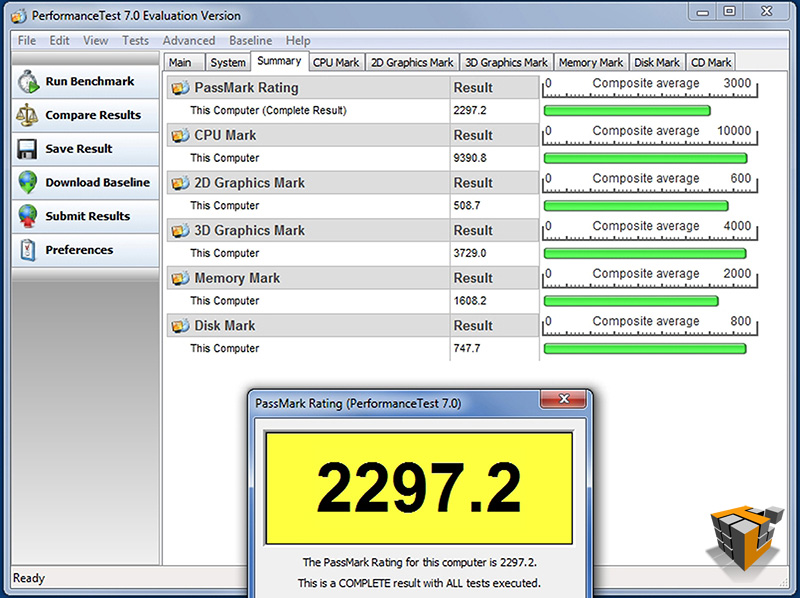
Another performance benchmark suite in our arsenal is PerformanceTest from PassMark. PassMark PerformanceTest allows you to objectively benchmark a PC using a variety of different speed tests and compare the results to other computers. We will use this suite to show the performance of the i7 2600K. This benchmark will also provide a clear indication of performance increases gained from overclocking later in this article.
 |
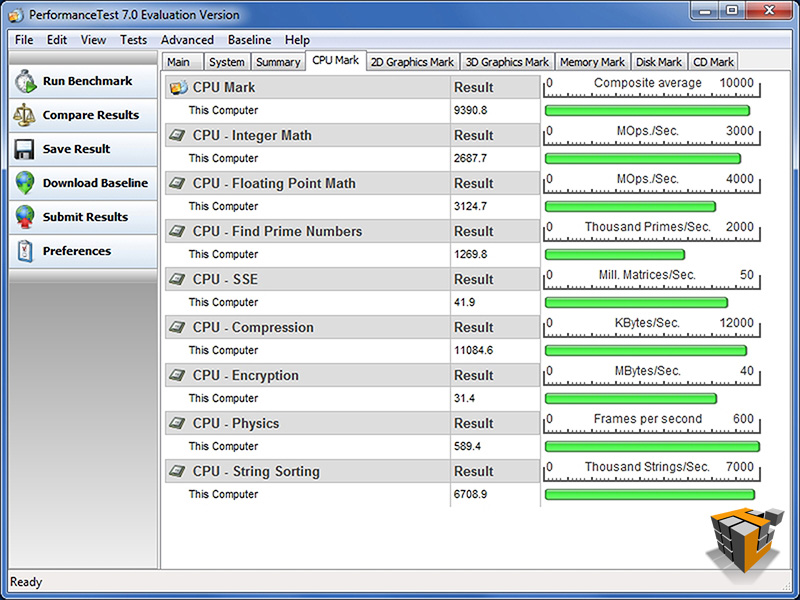 |
| PassMark Rating – 2297.2 |
CPU Rating – 9390.8 |
| [2500K] 7102.1 | |
 |
|
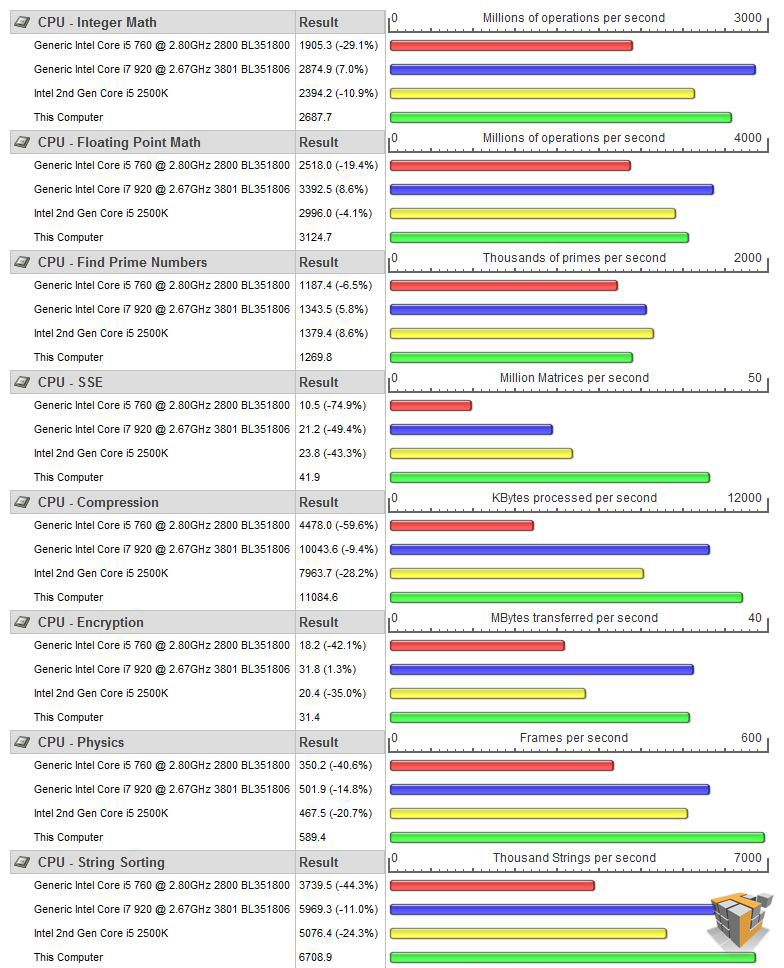
|
Detailed CPU comparison to i5 760, i7 920, and i5-2500K The Core i7 2600K is in green |
|
The 2nd Gen Core i7 2600K is more than capable and it shows. Pay close attention to the comparison graph, this will serve as a great visual indicator of performance increase during over-clocking later on.
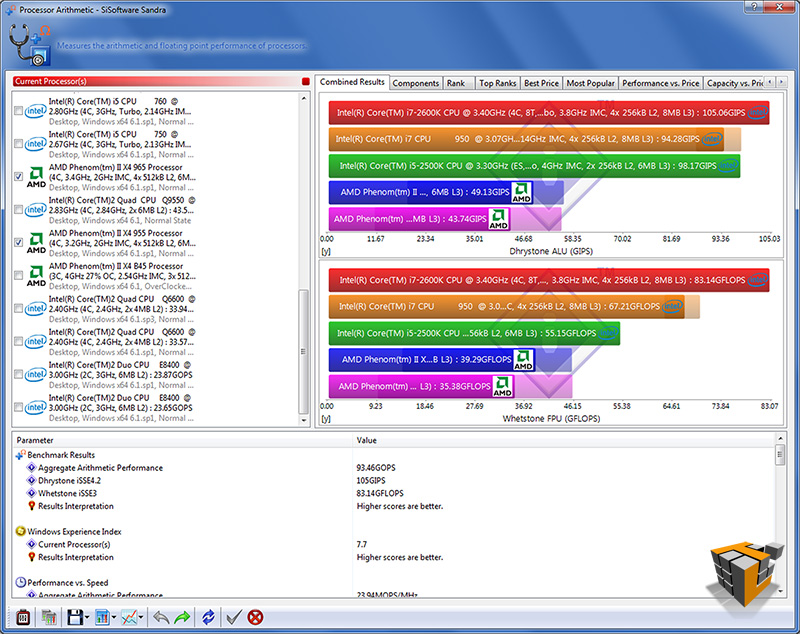
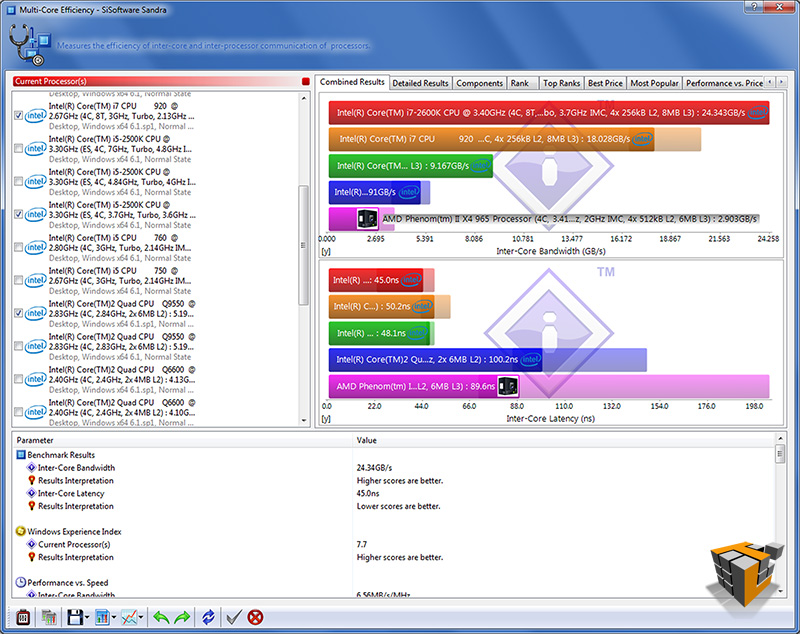
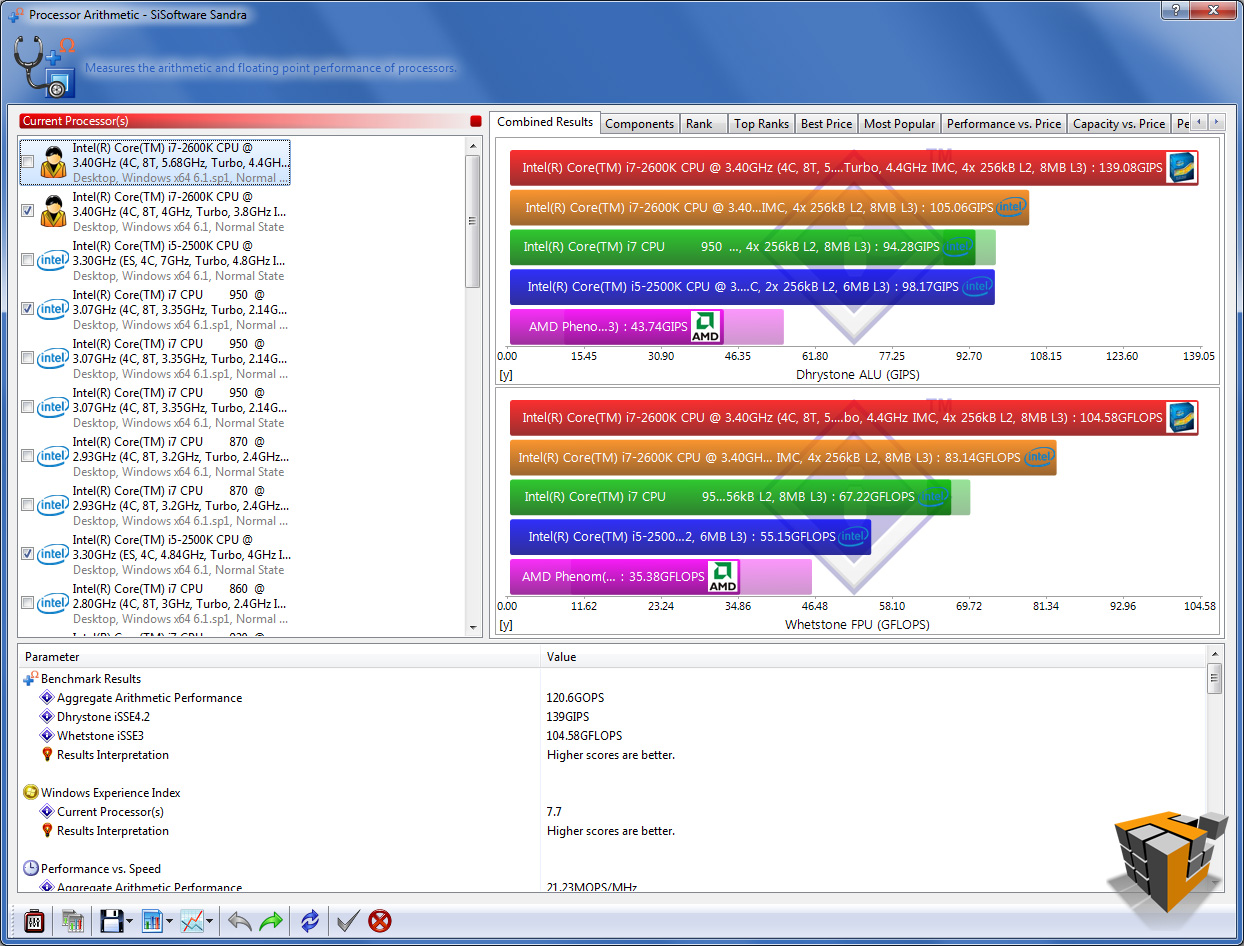
SiSoftware Sandra 2011c
The Sandra suite gives us a more detailed look at the processor performance in particular areas of interest. There are 5 processor benchmarks of interest for our purposes today.
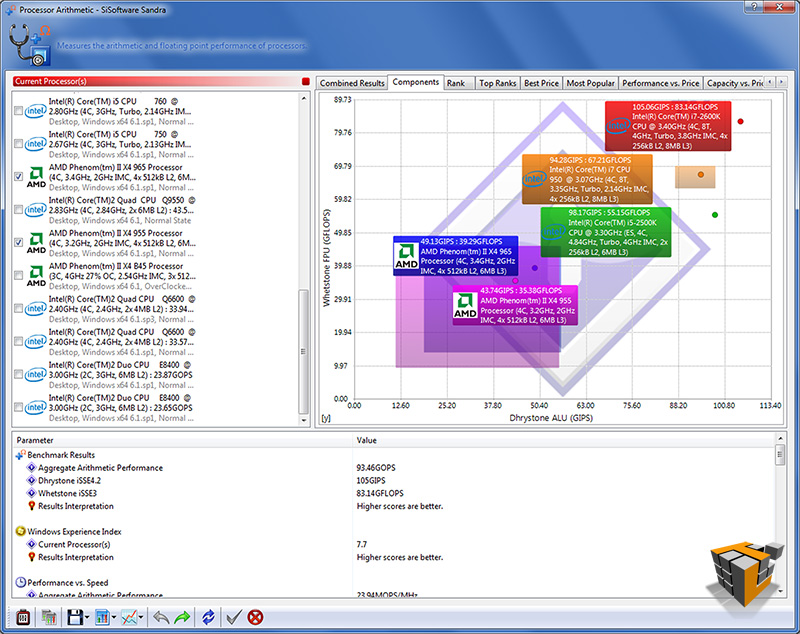
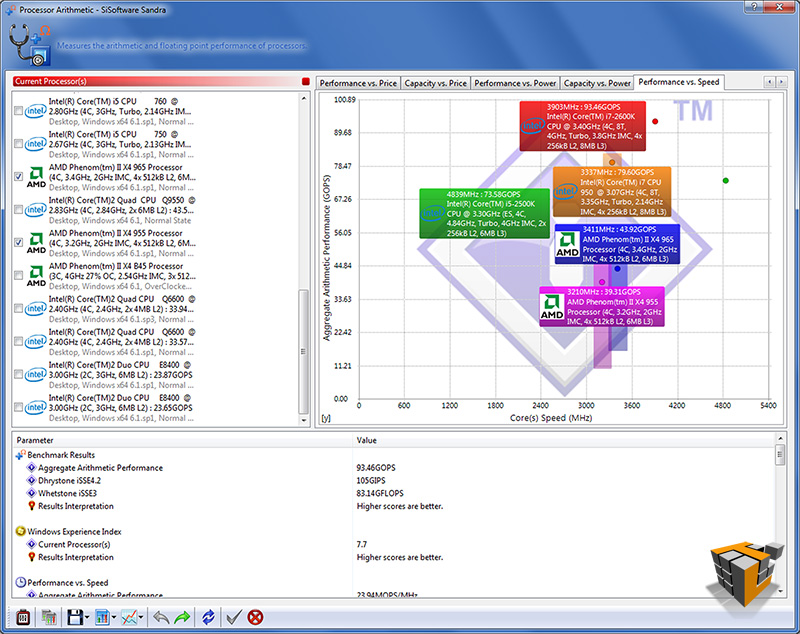
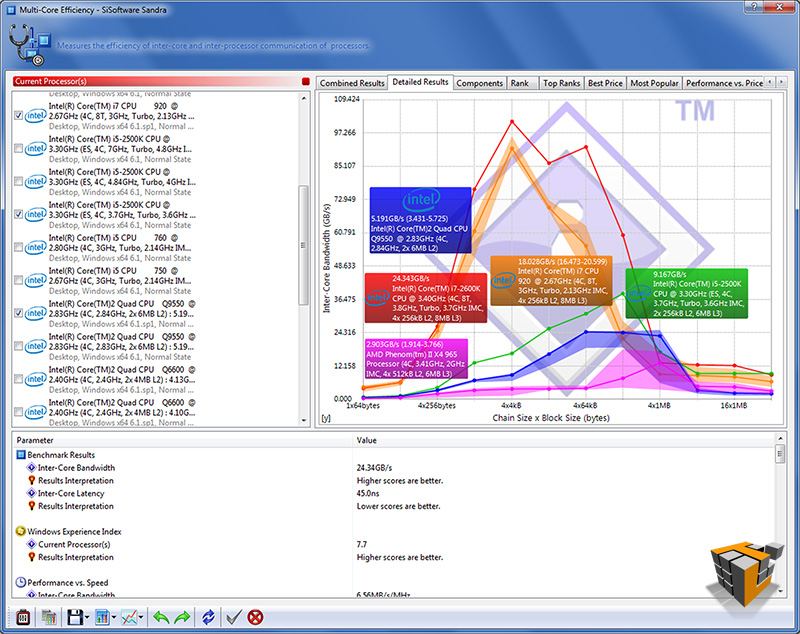
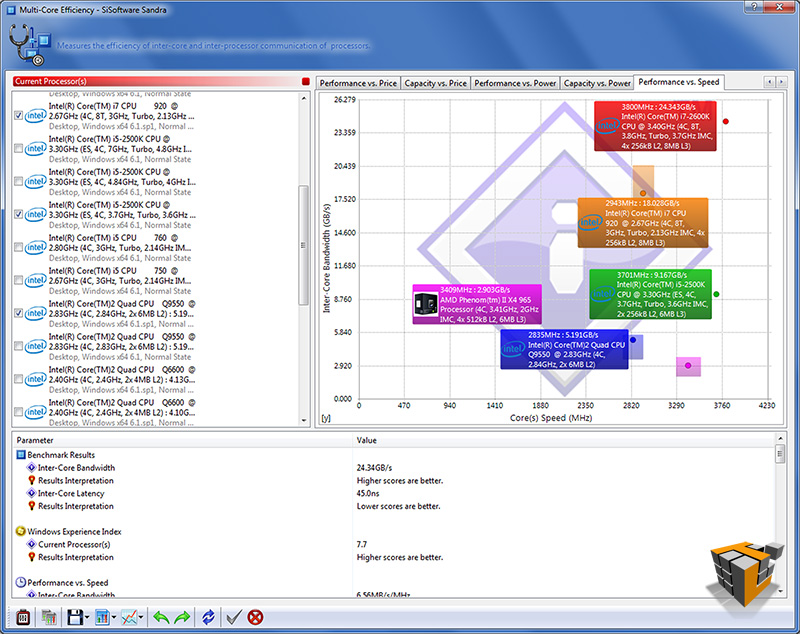
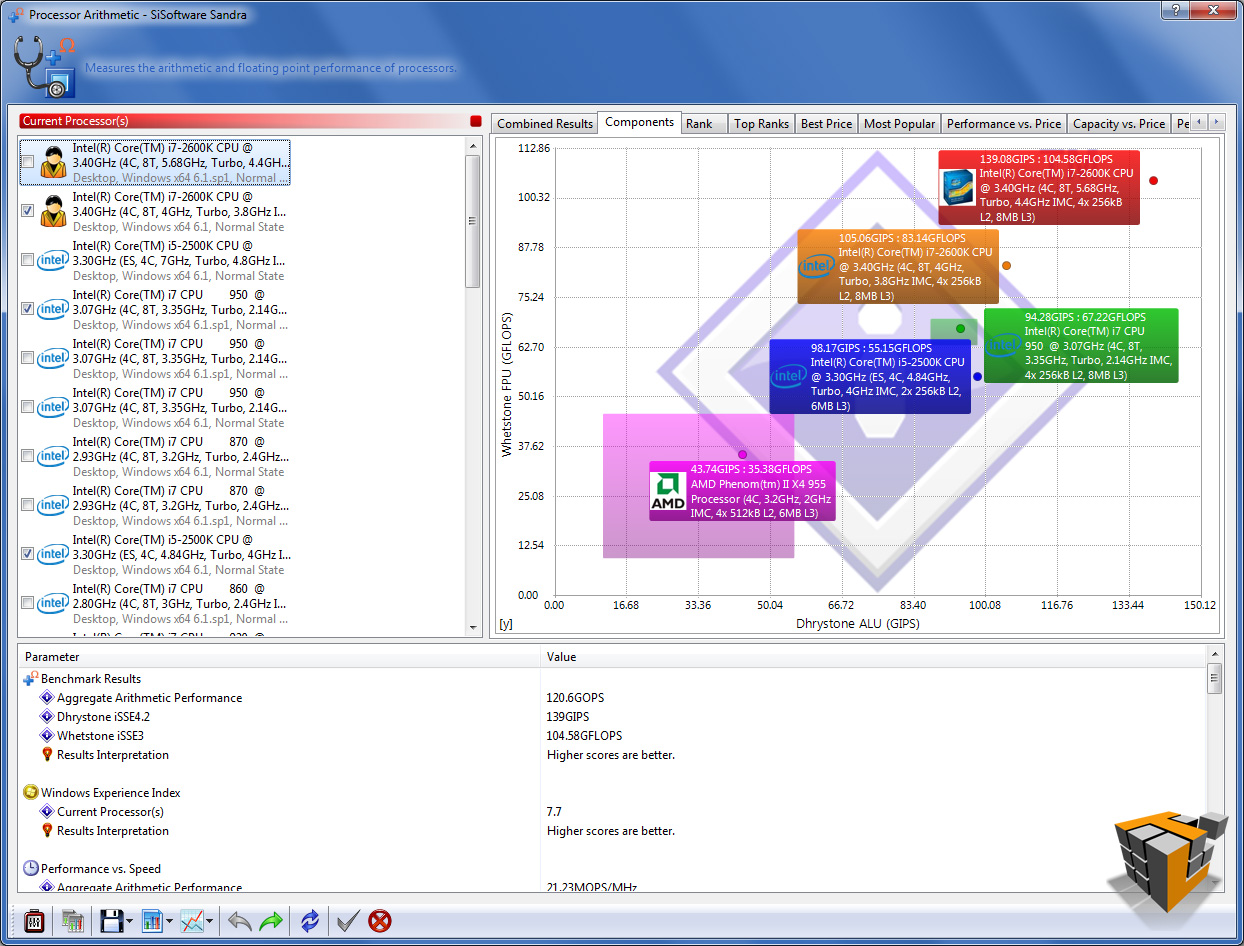
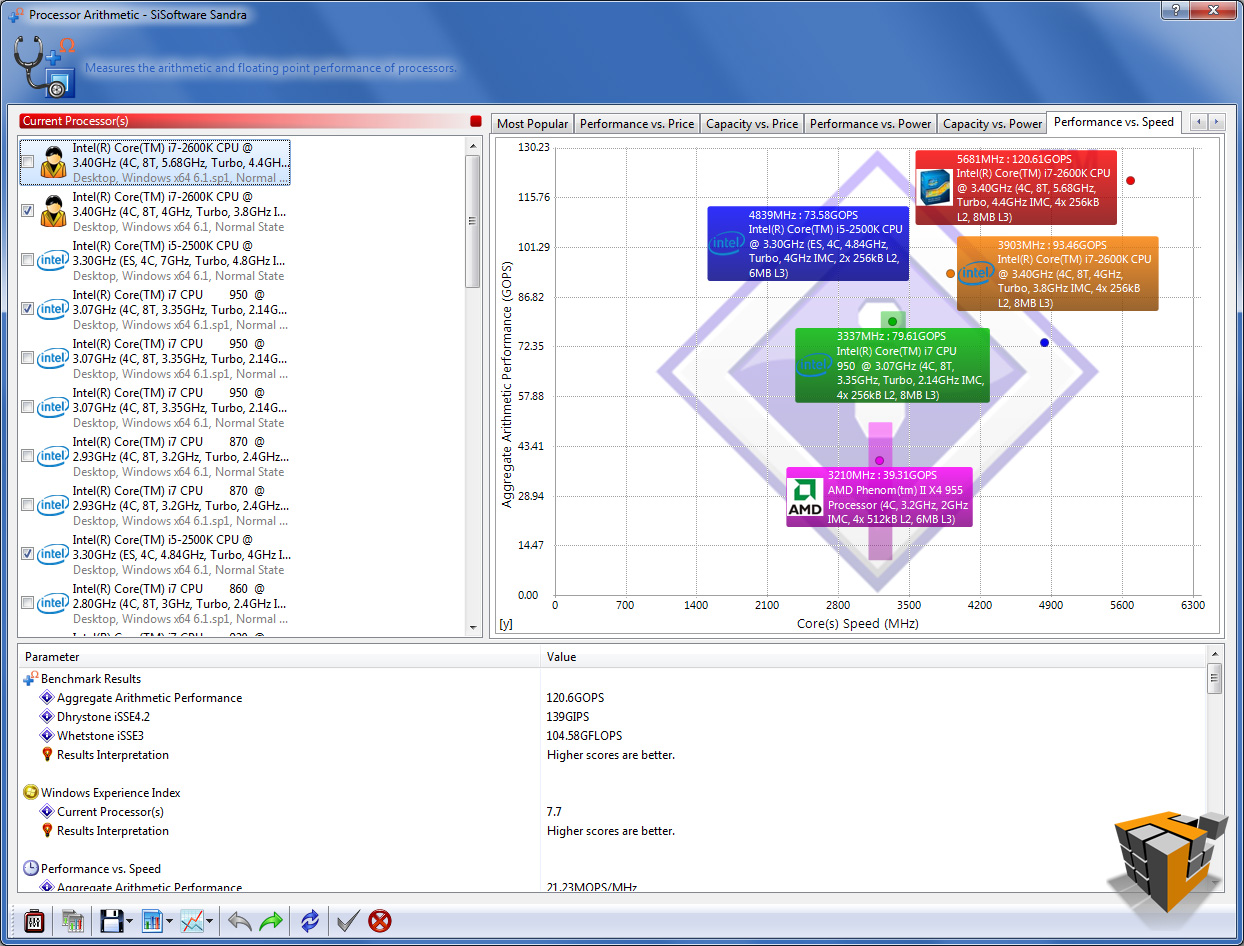
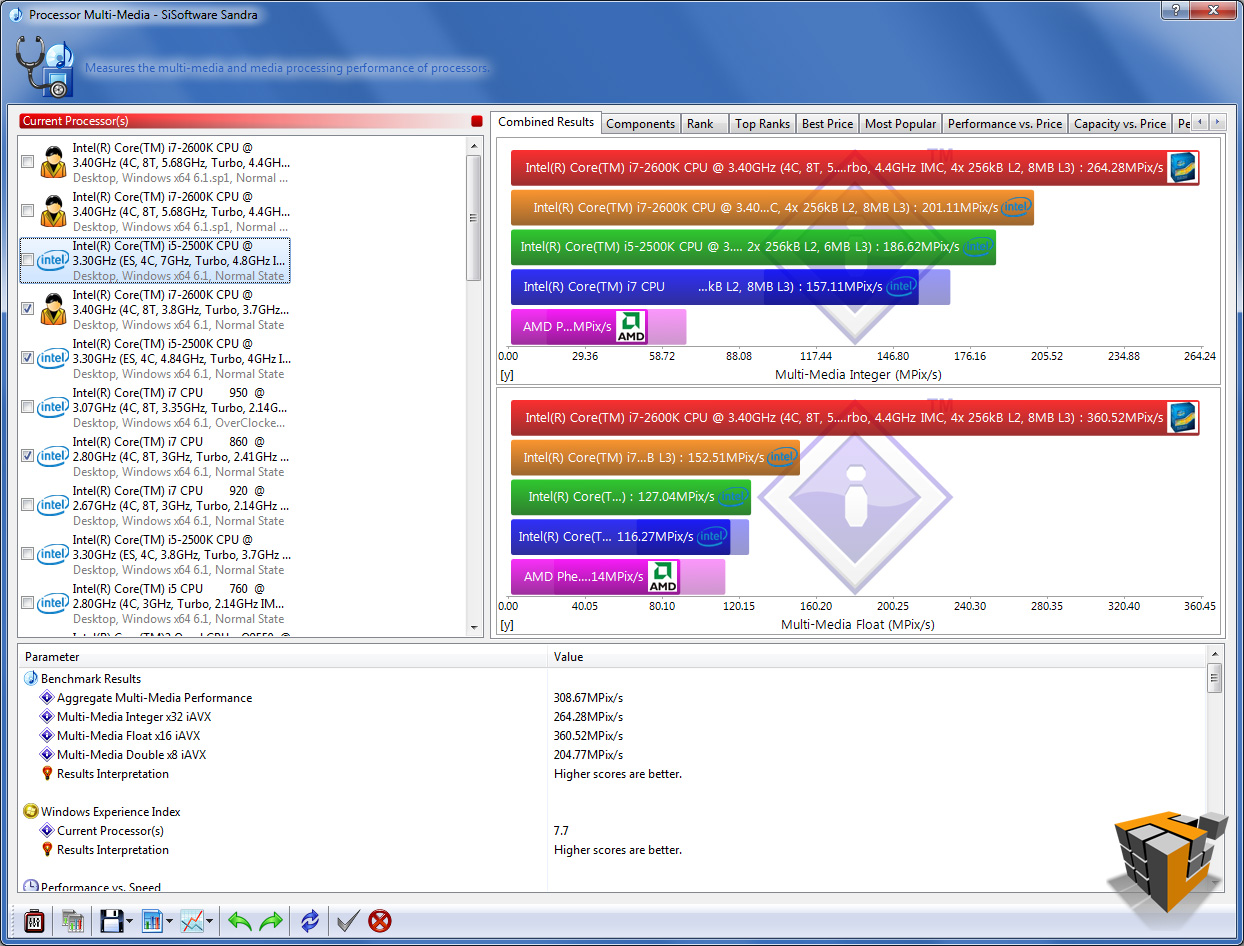
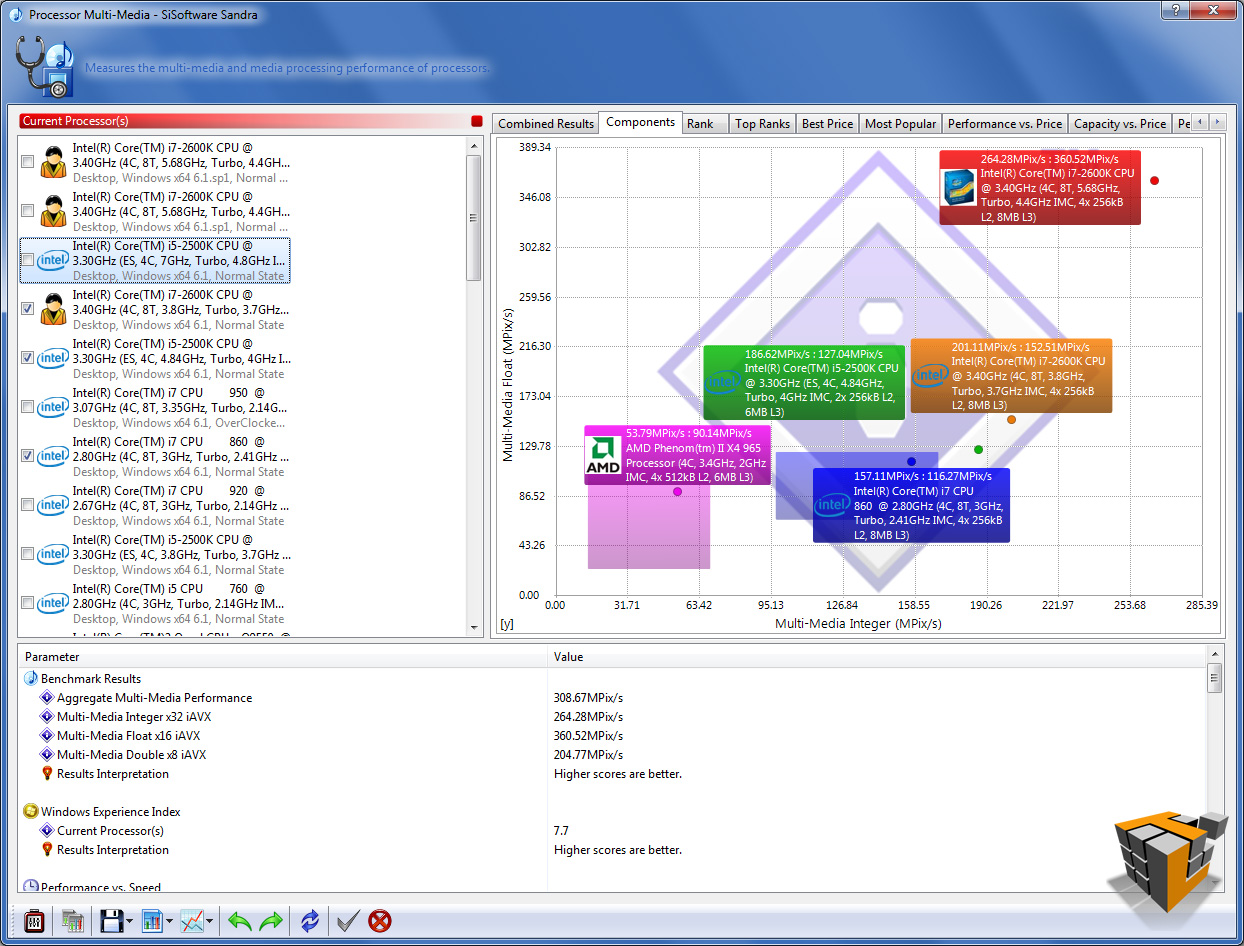
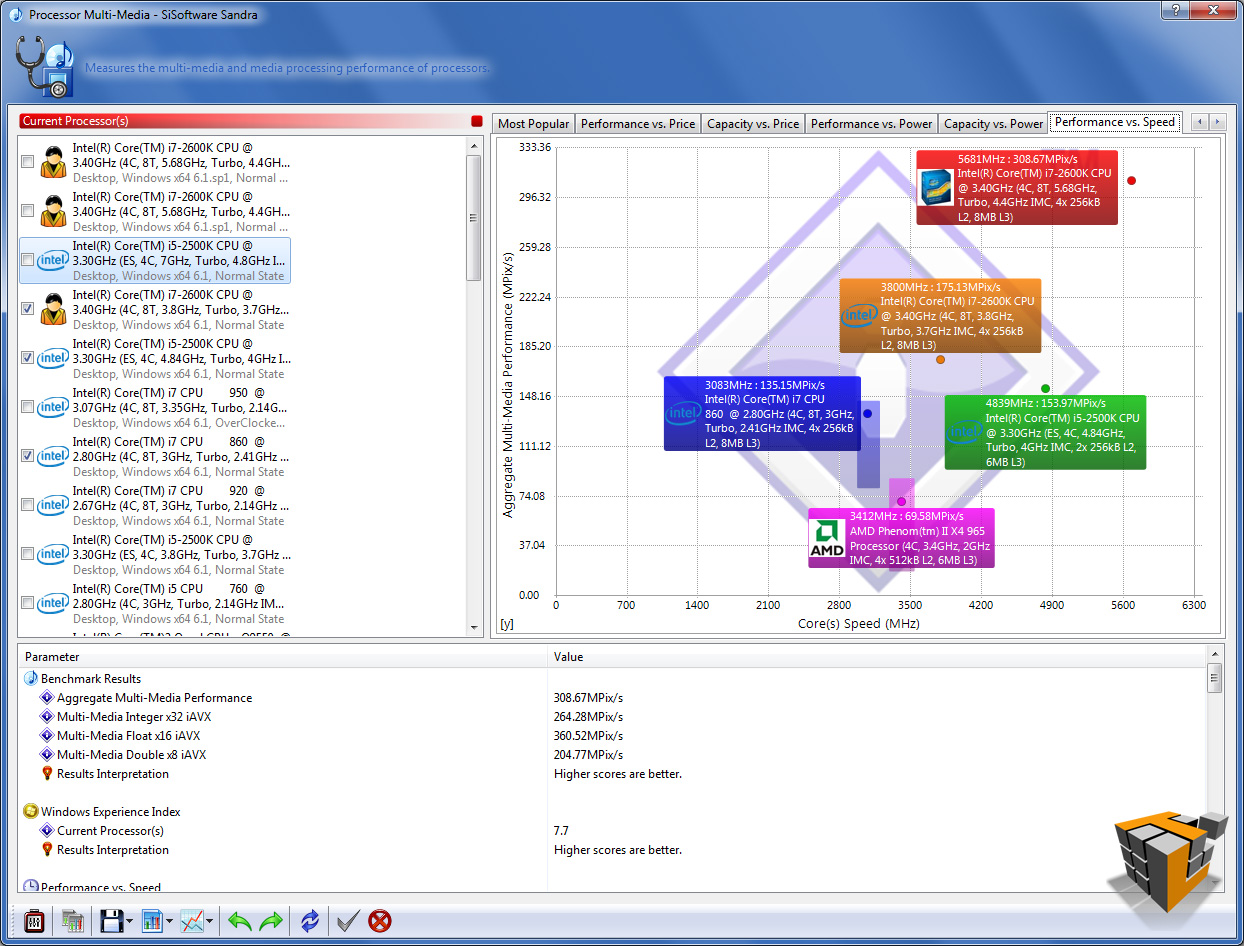
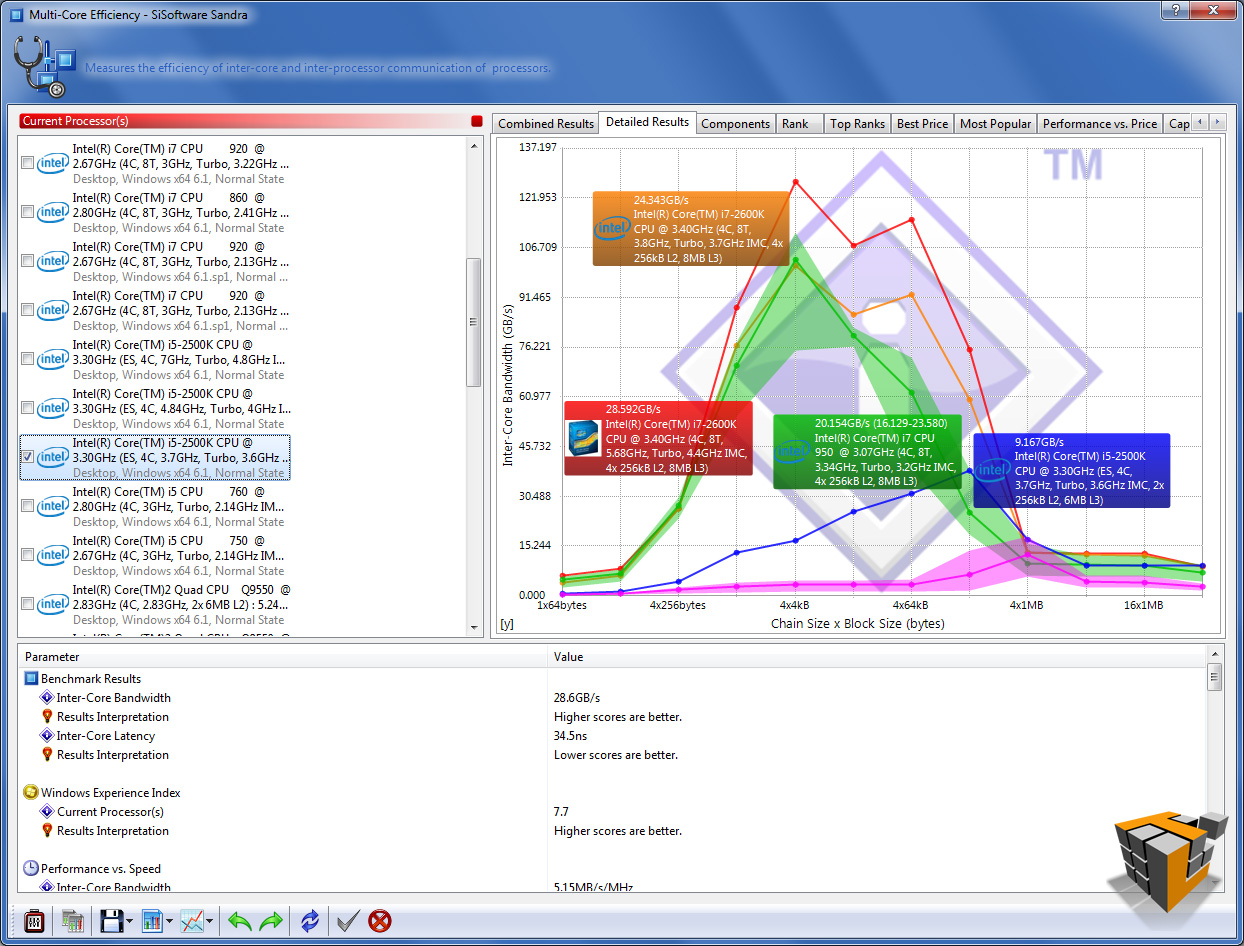
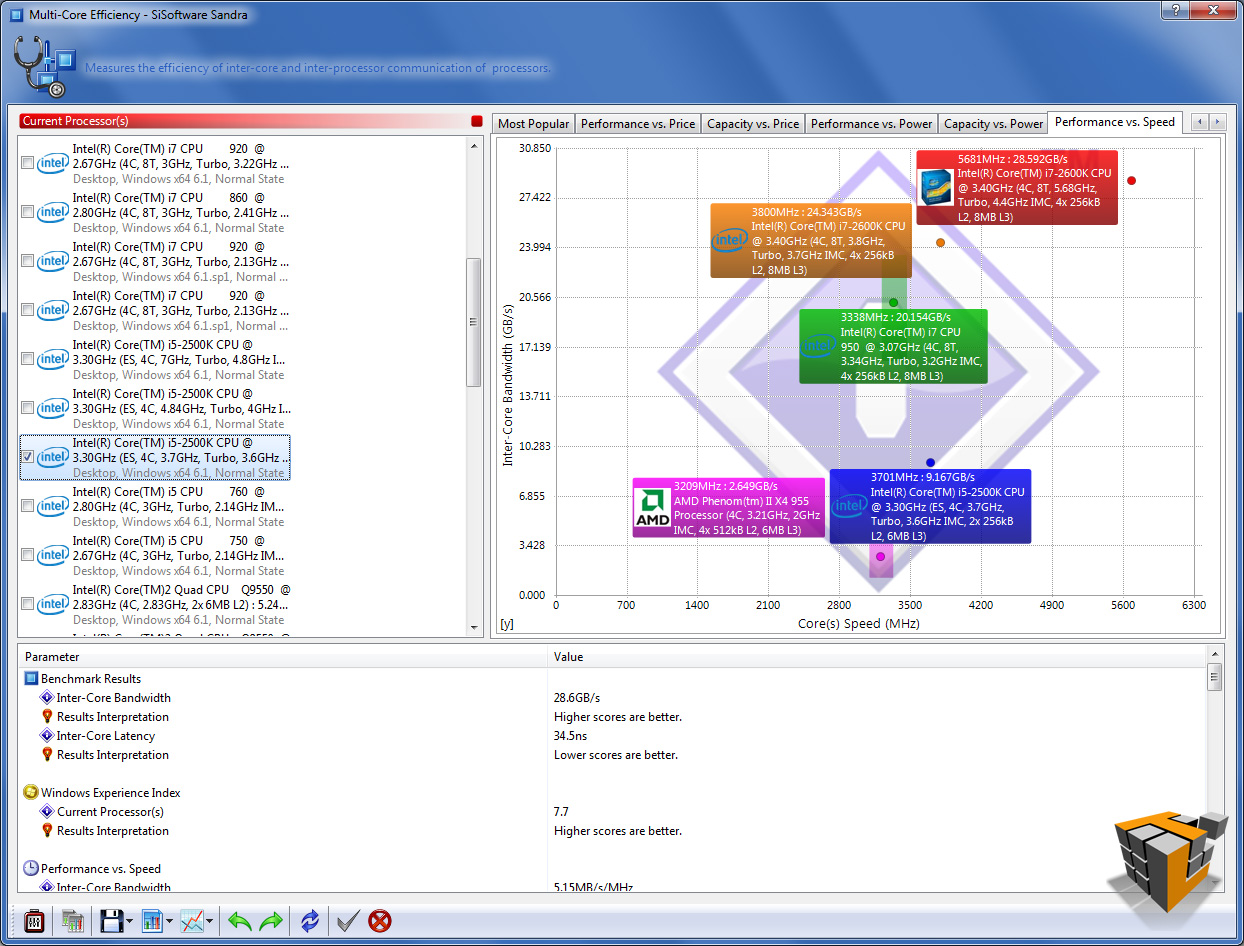
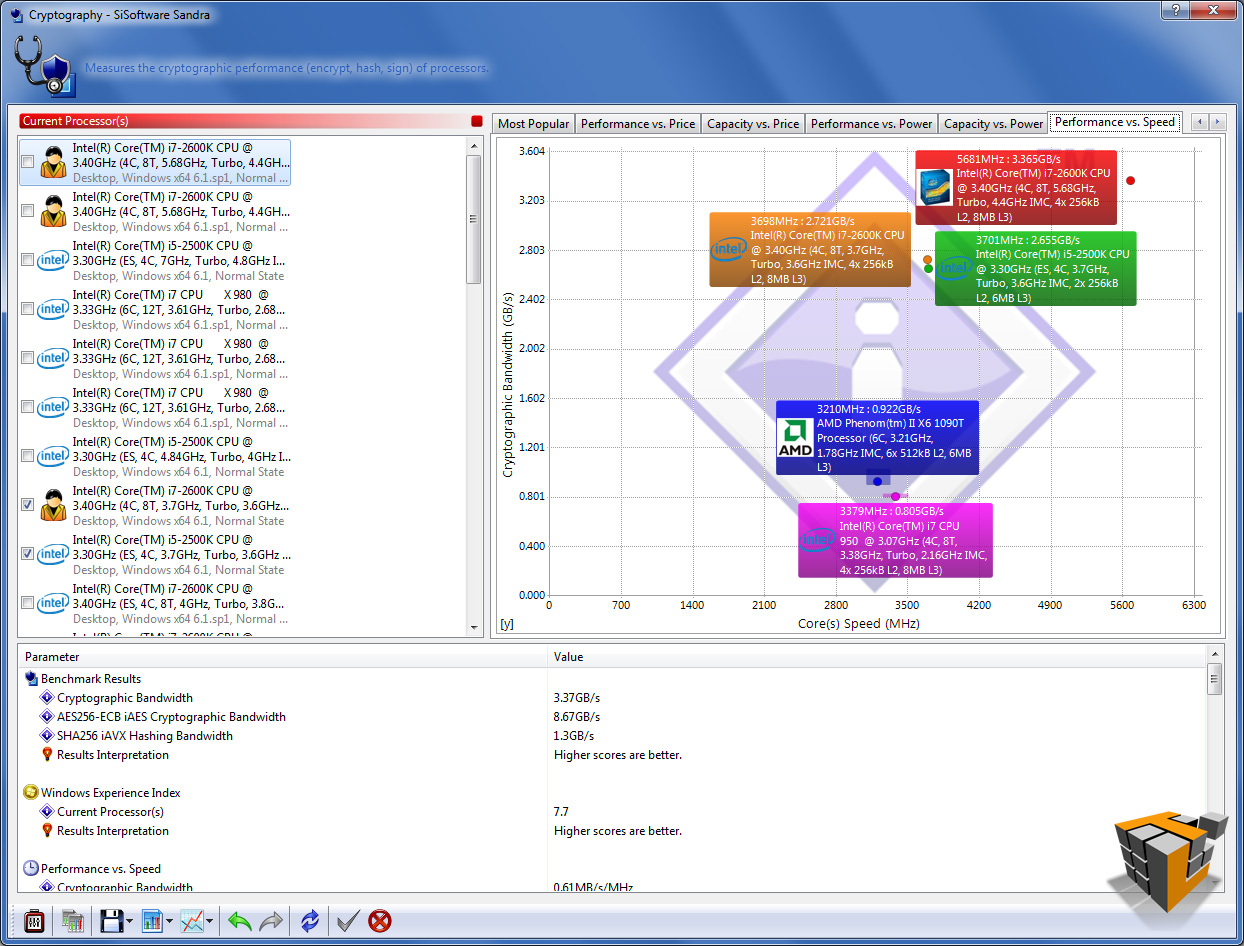
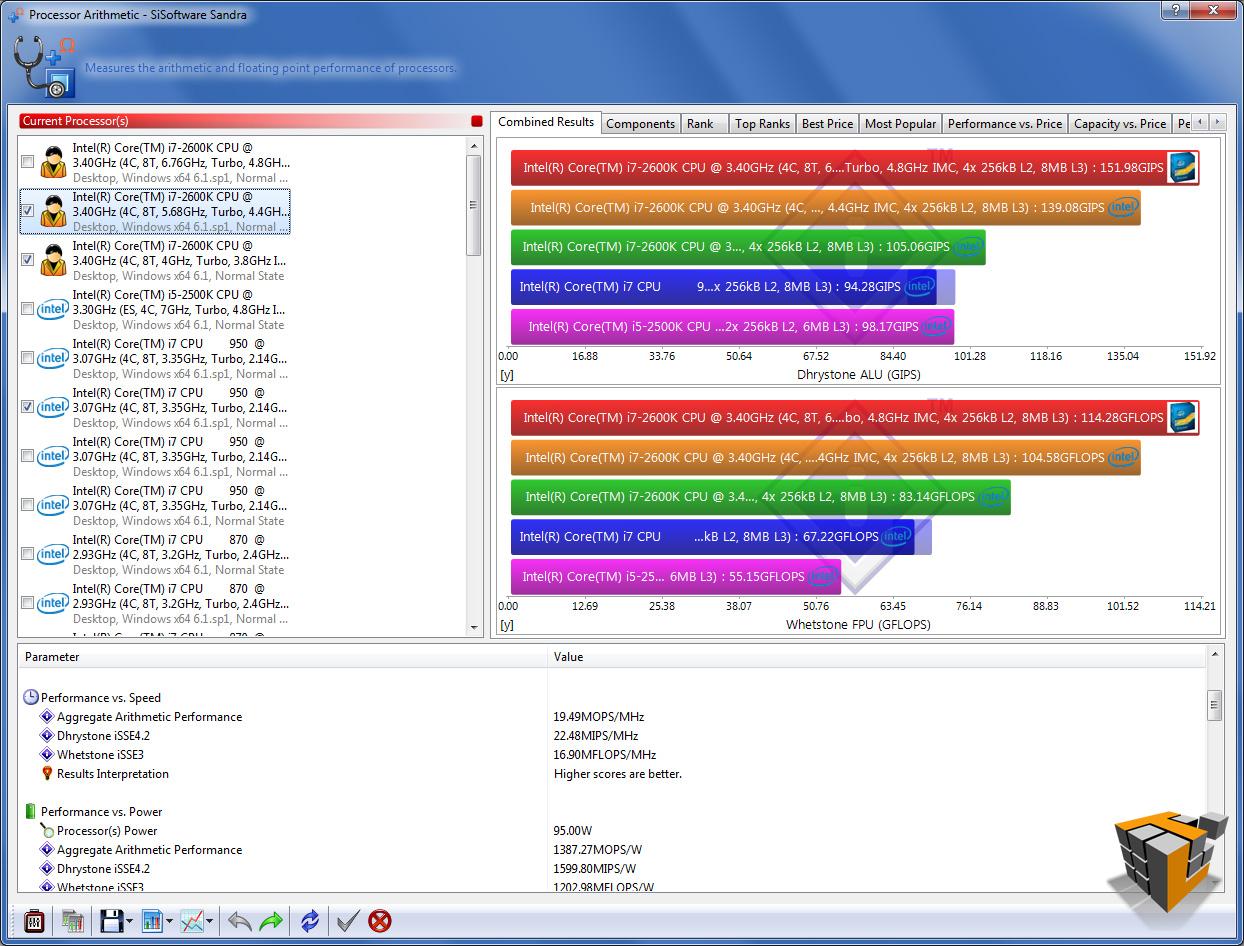
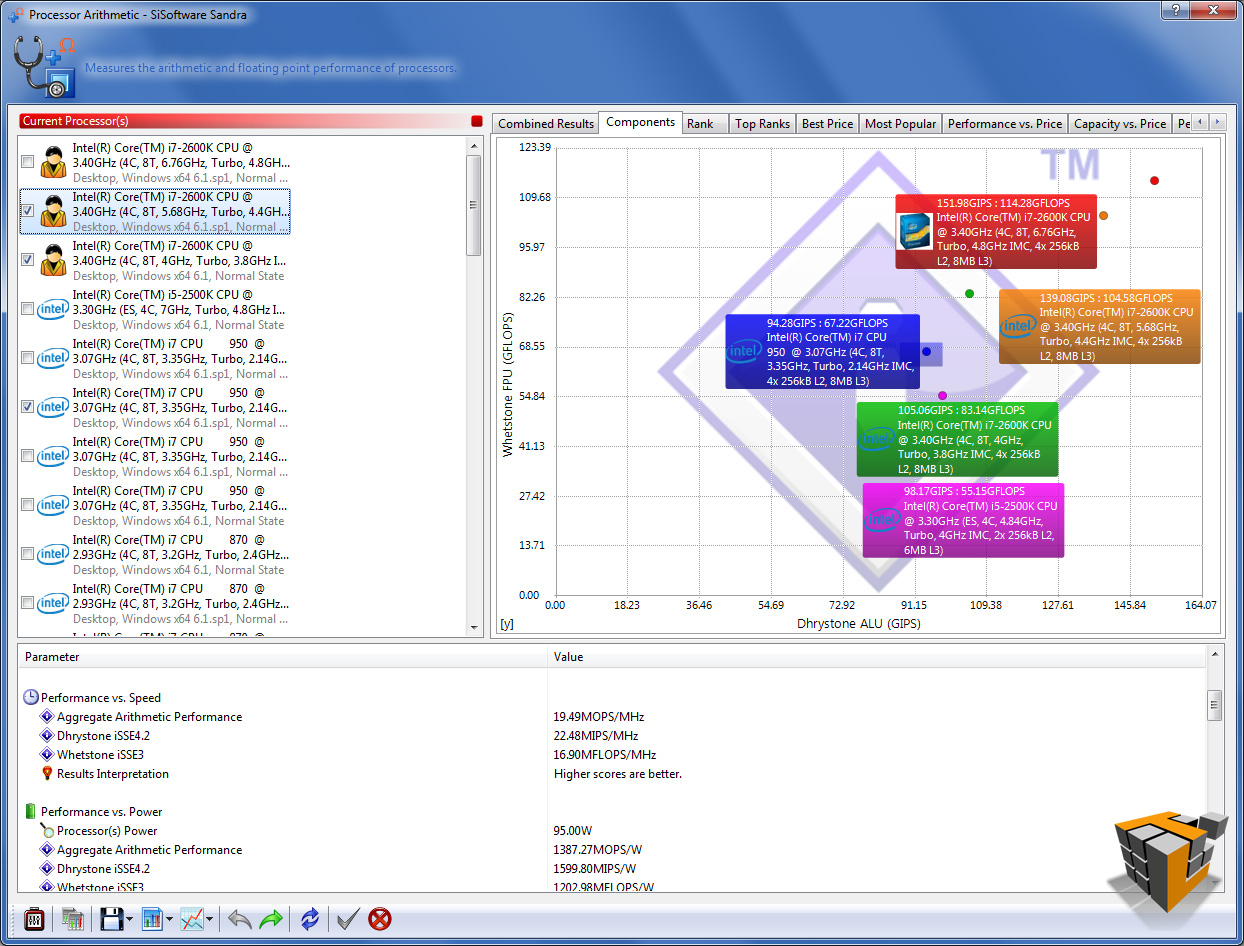
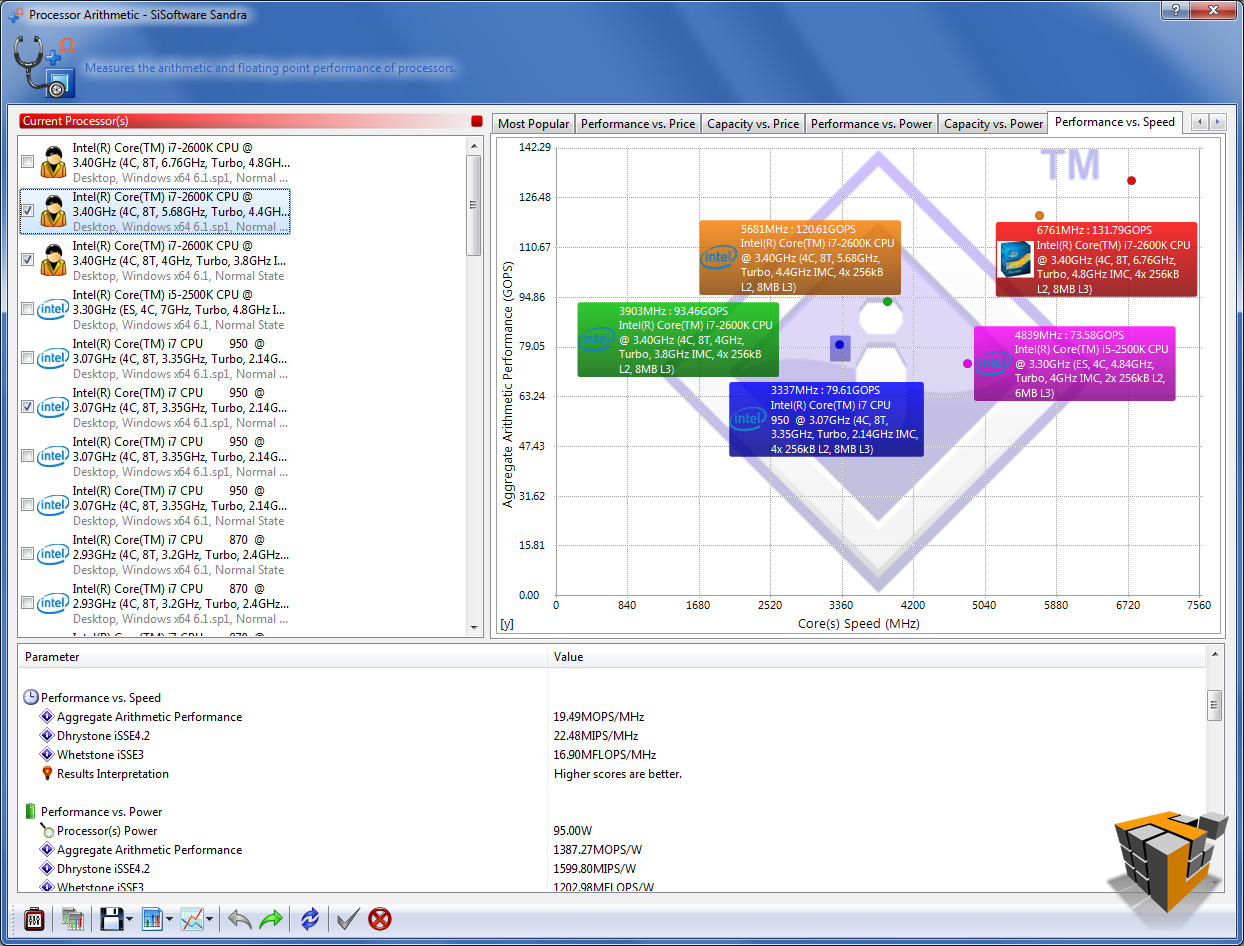
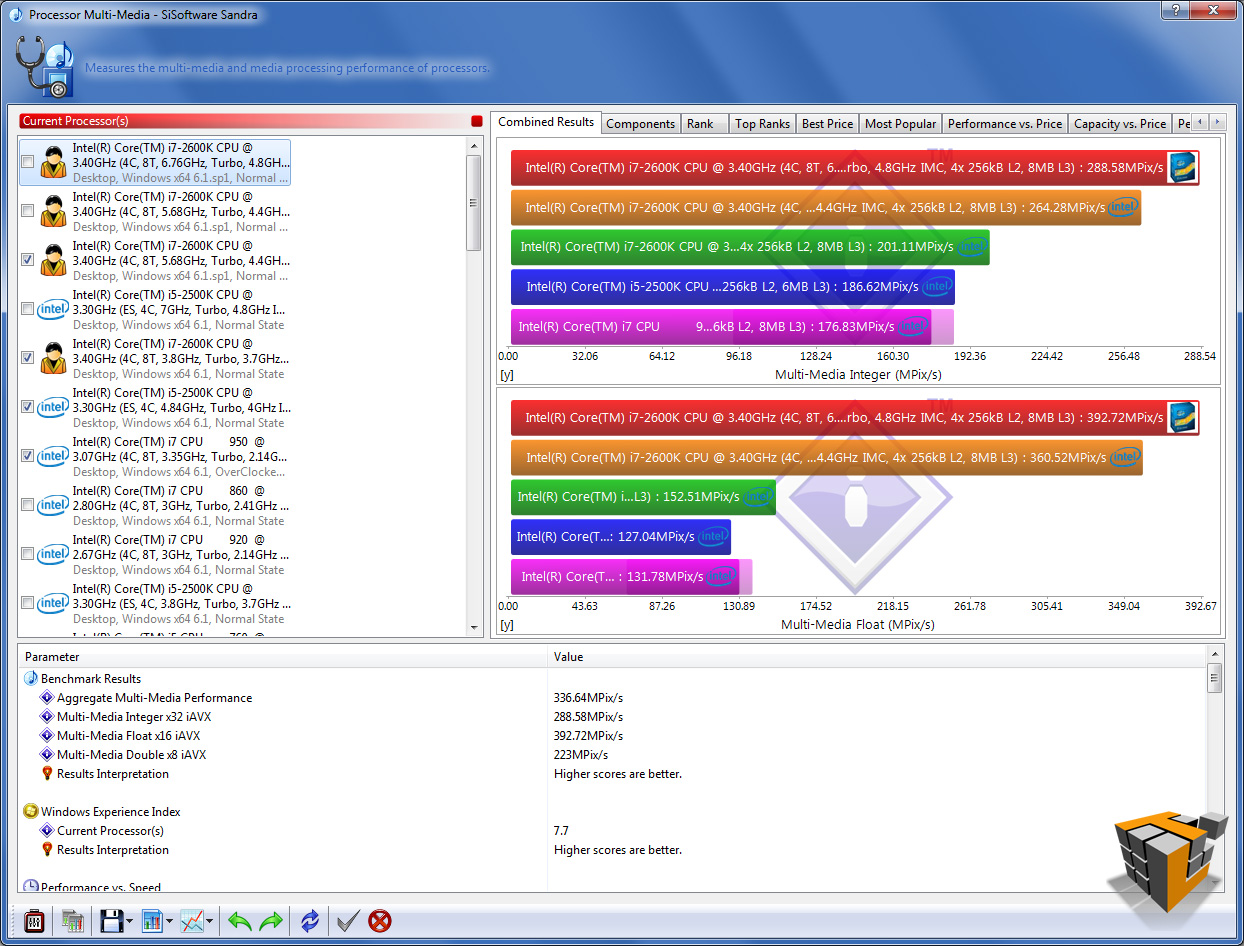
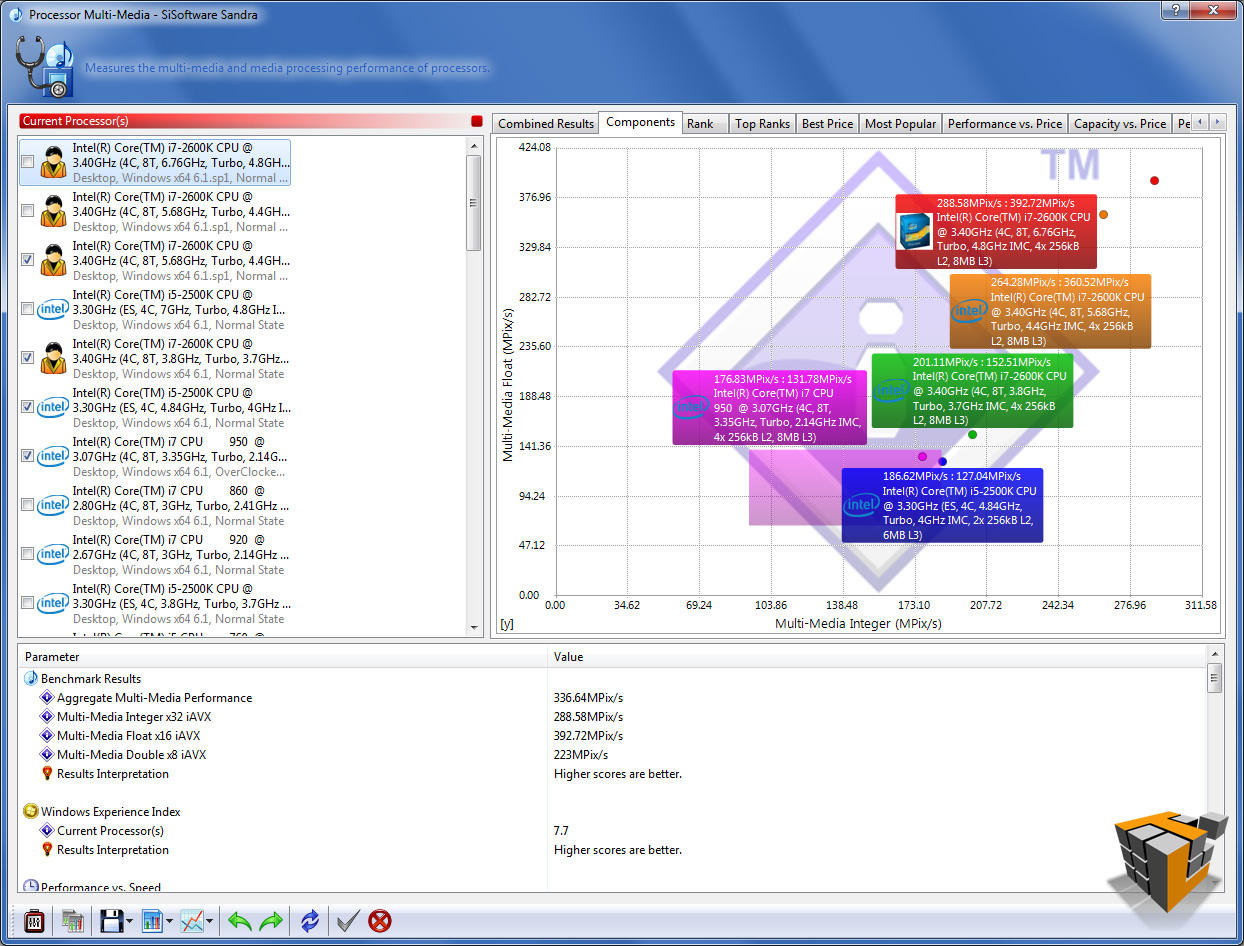
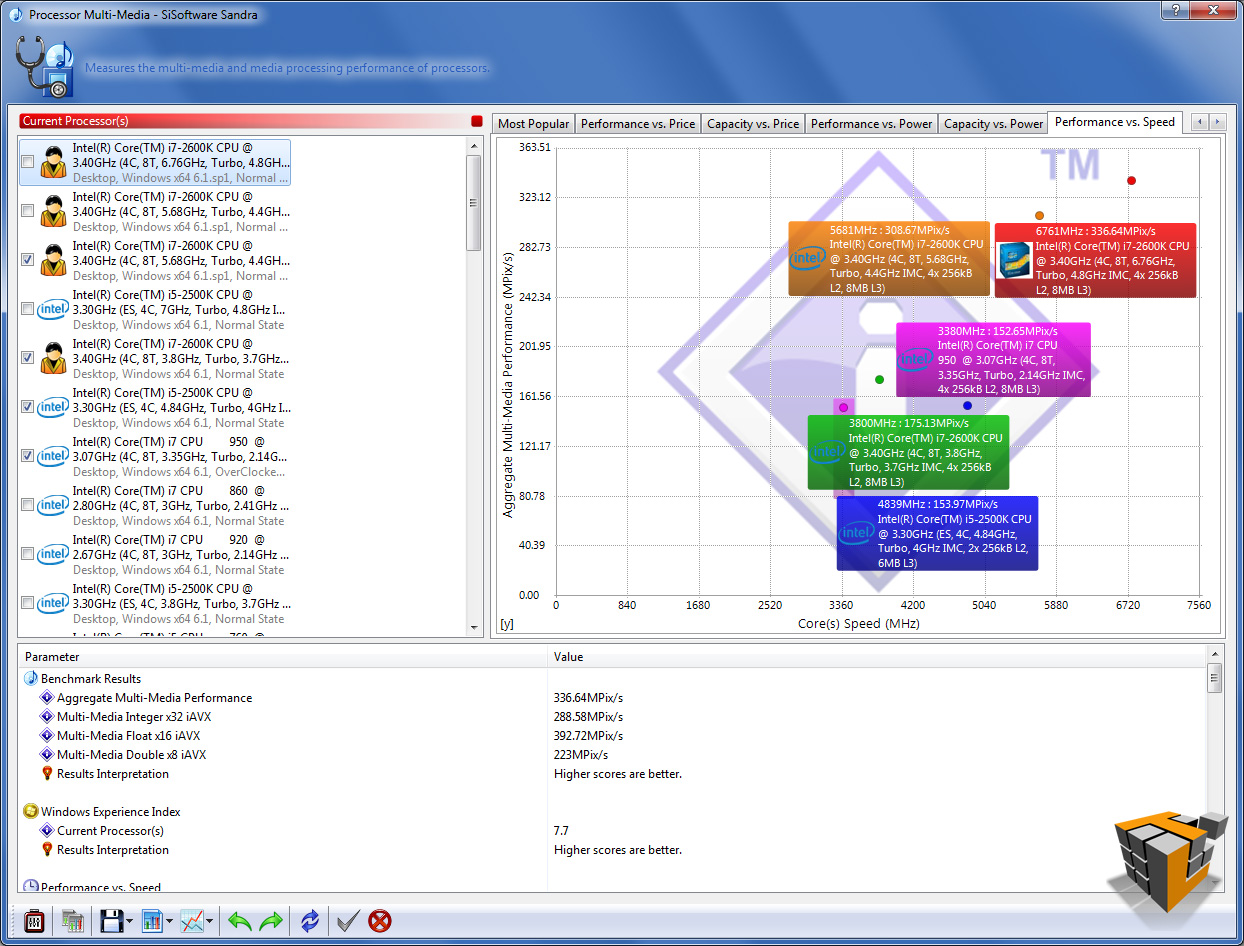
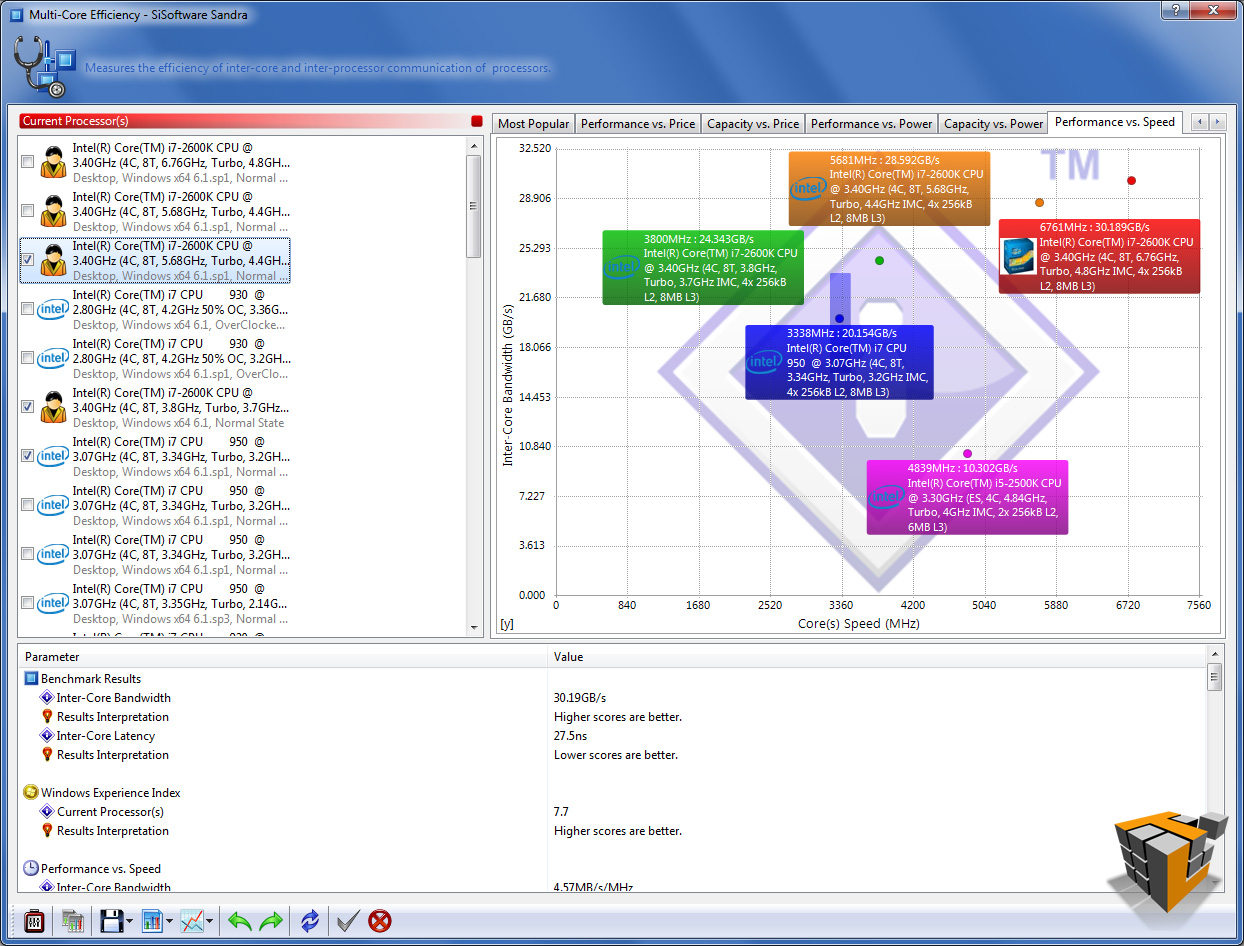
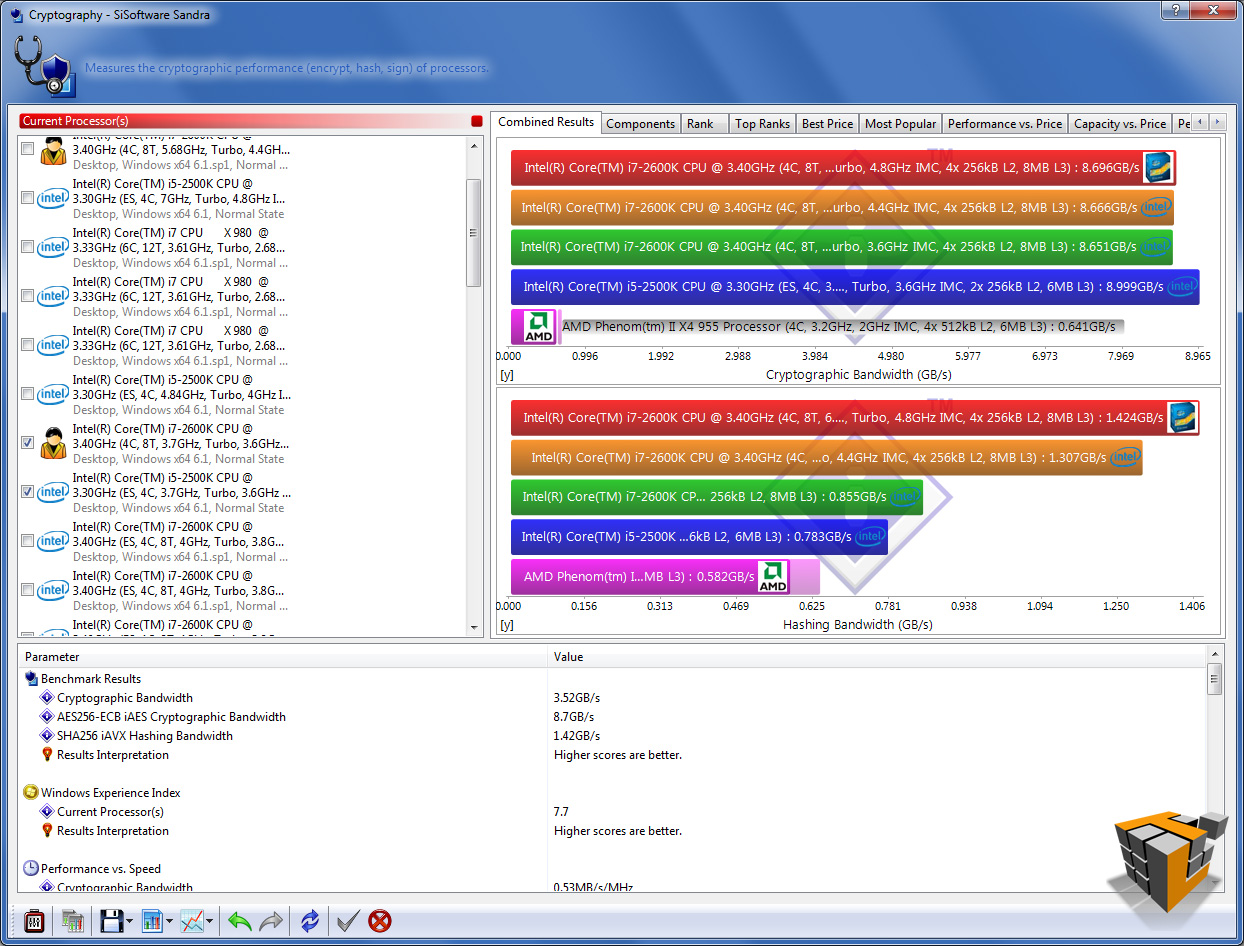
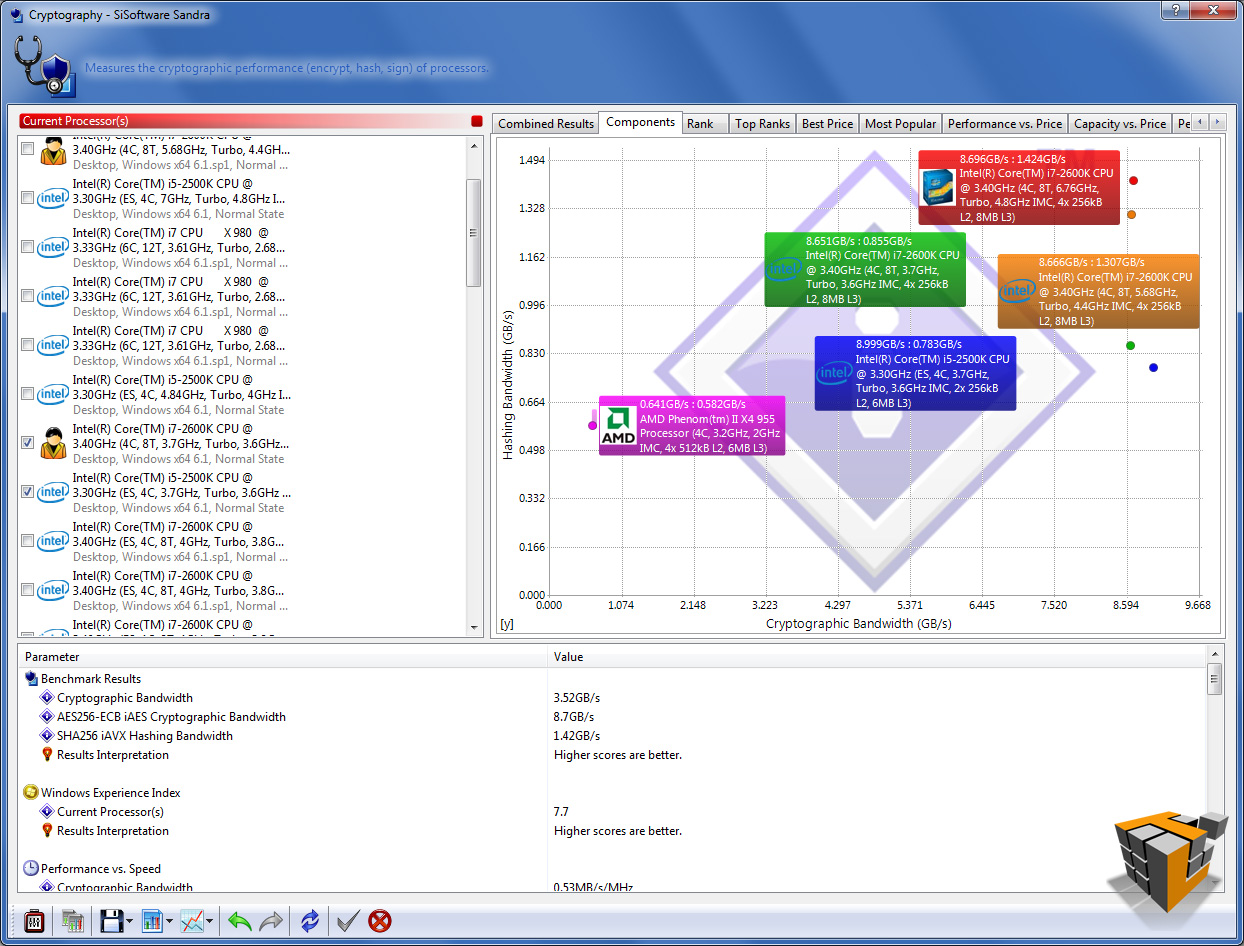
The table below has 5 rows, 1 for each test; each row has 3 graphs. The left graph is the combined result, the center graph compares the 2 components tested, the last right chart is ‘Performance vs Speed’ best results of this graph are furthest to the right and nearest the top of the chart.
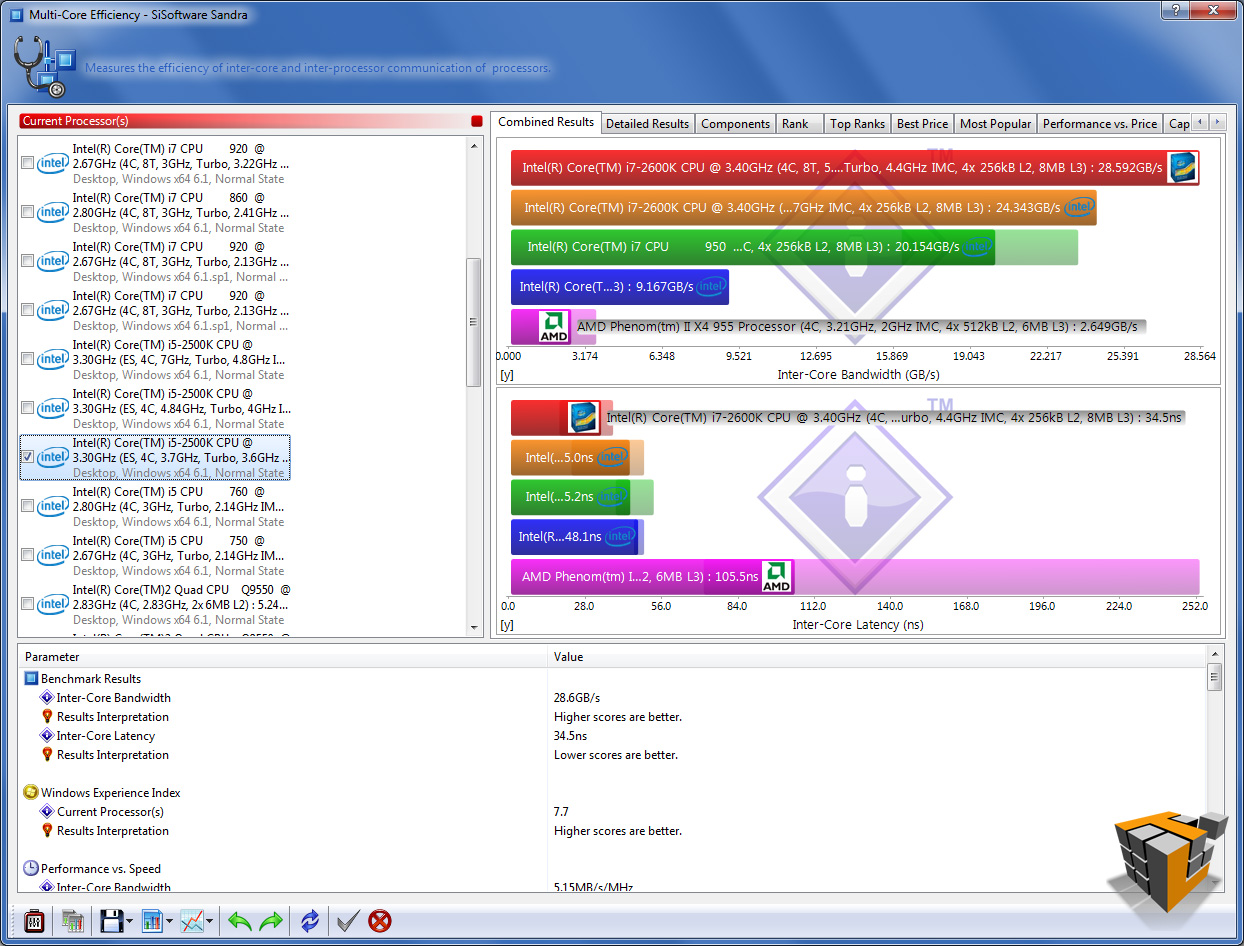
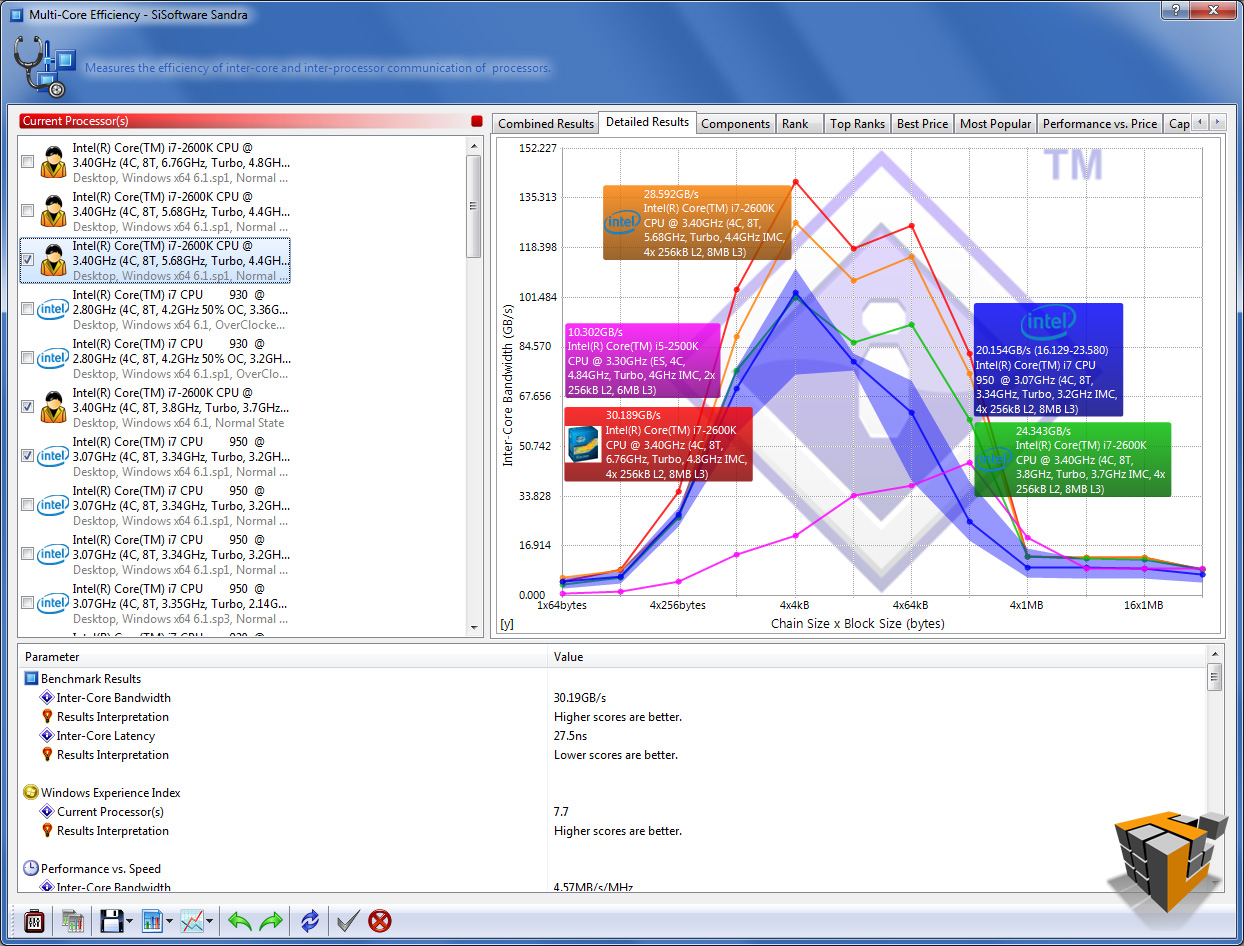
Overall the results translate as follows: higher results or longer bars equal better performance, with the exception of the Multi-Core Efficiency latency test in row 3 highlight in orange (bottom half of the image labeled ‘Inter-Core Efficiency’).
Processor Arithmetic: Benchmarks the ALU and FPU processor units. Shows how your processors handle arithmetic and floating point instructions in comparison to other typical processors.
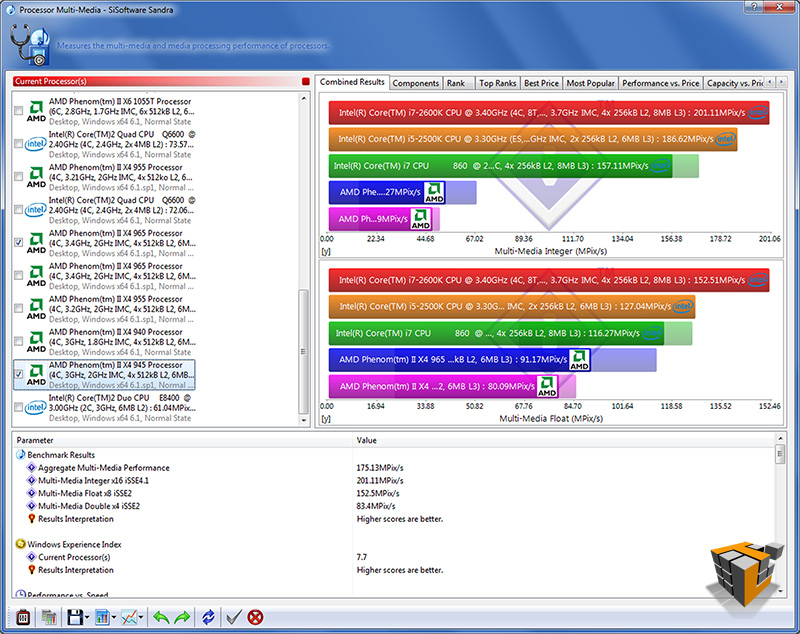
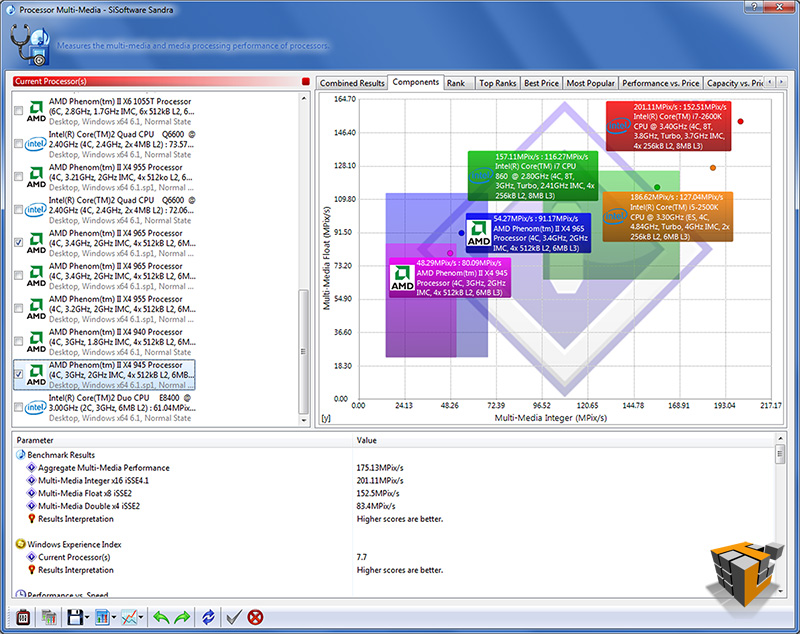
Processor Multi-Media: Benchmark the SIMD processor units. Shows how your processors handle multi-media instructions and data in comparison to other typical processors.
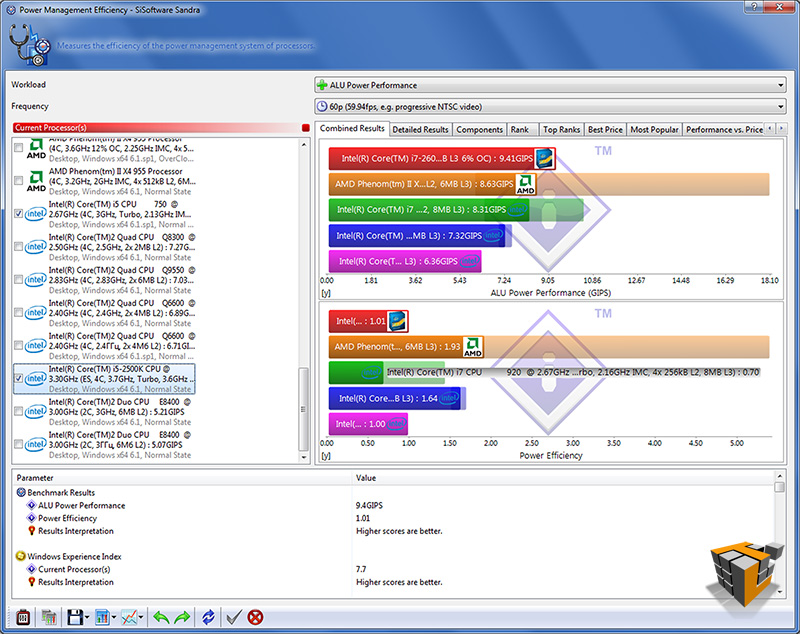
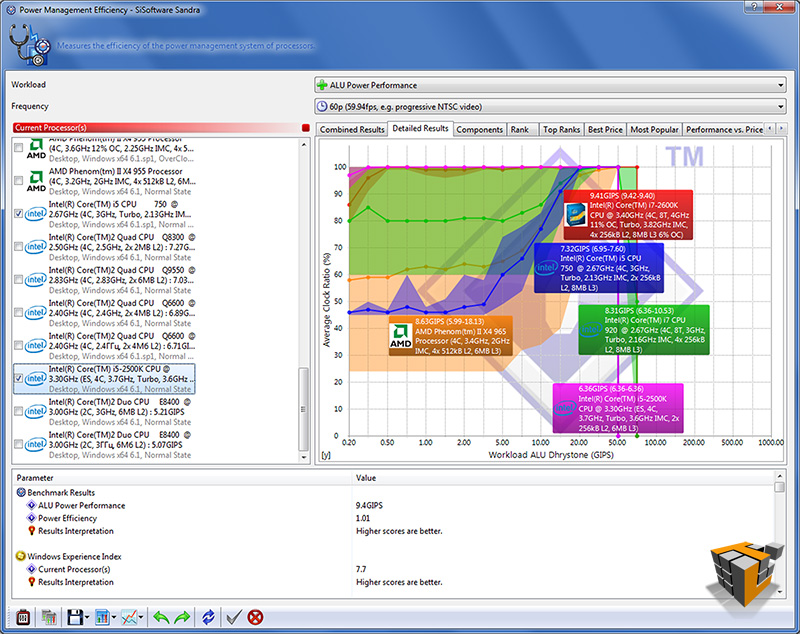
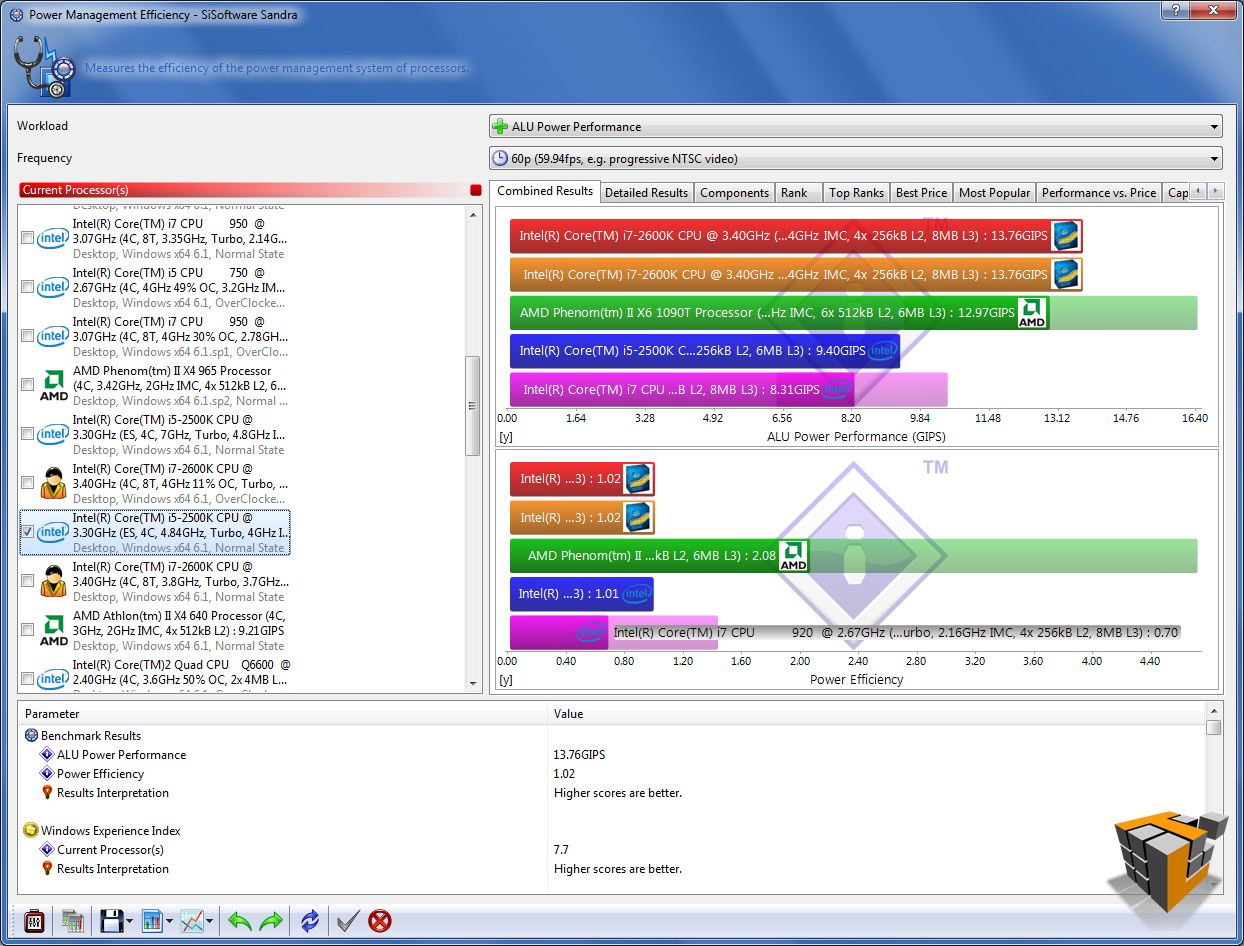
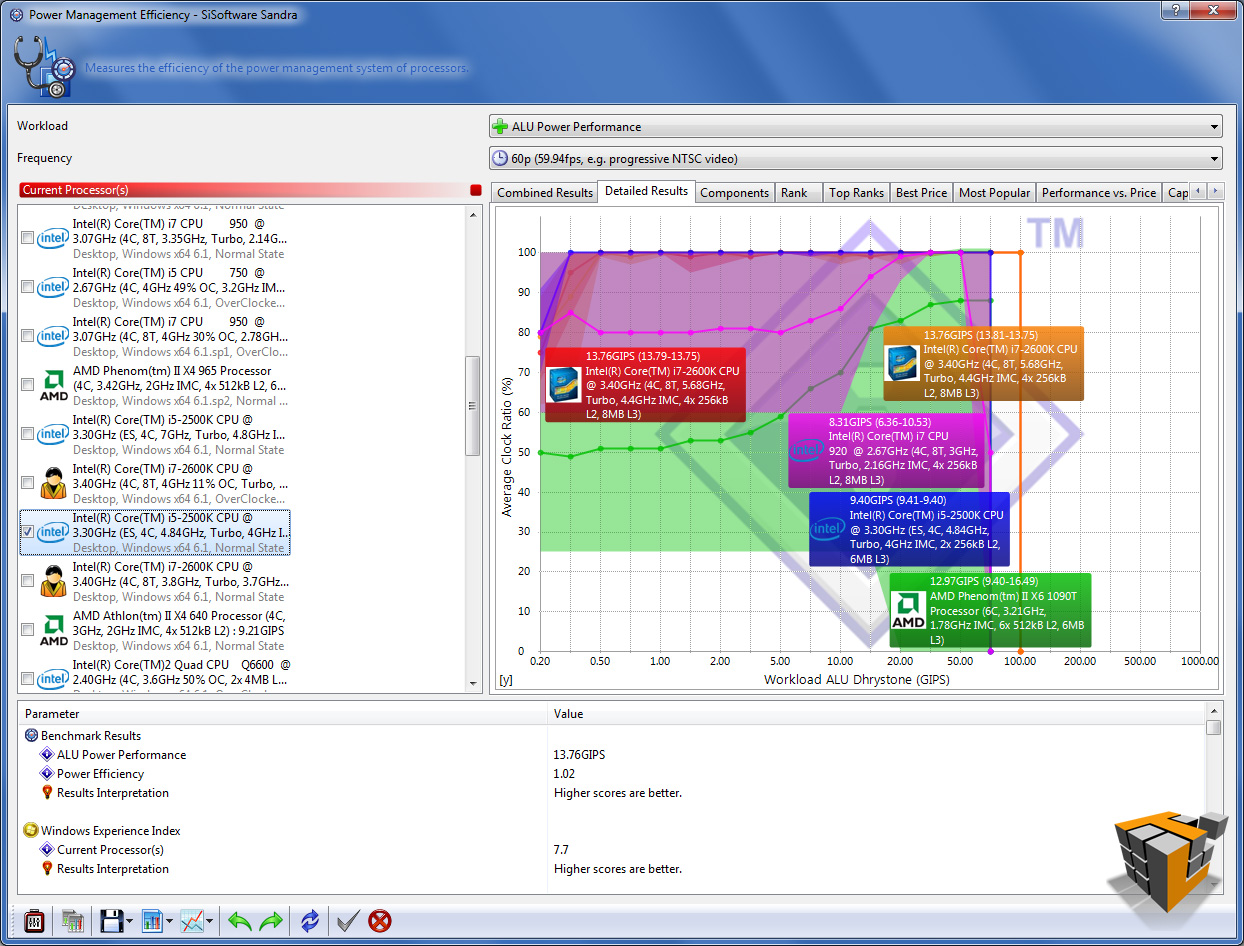
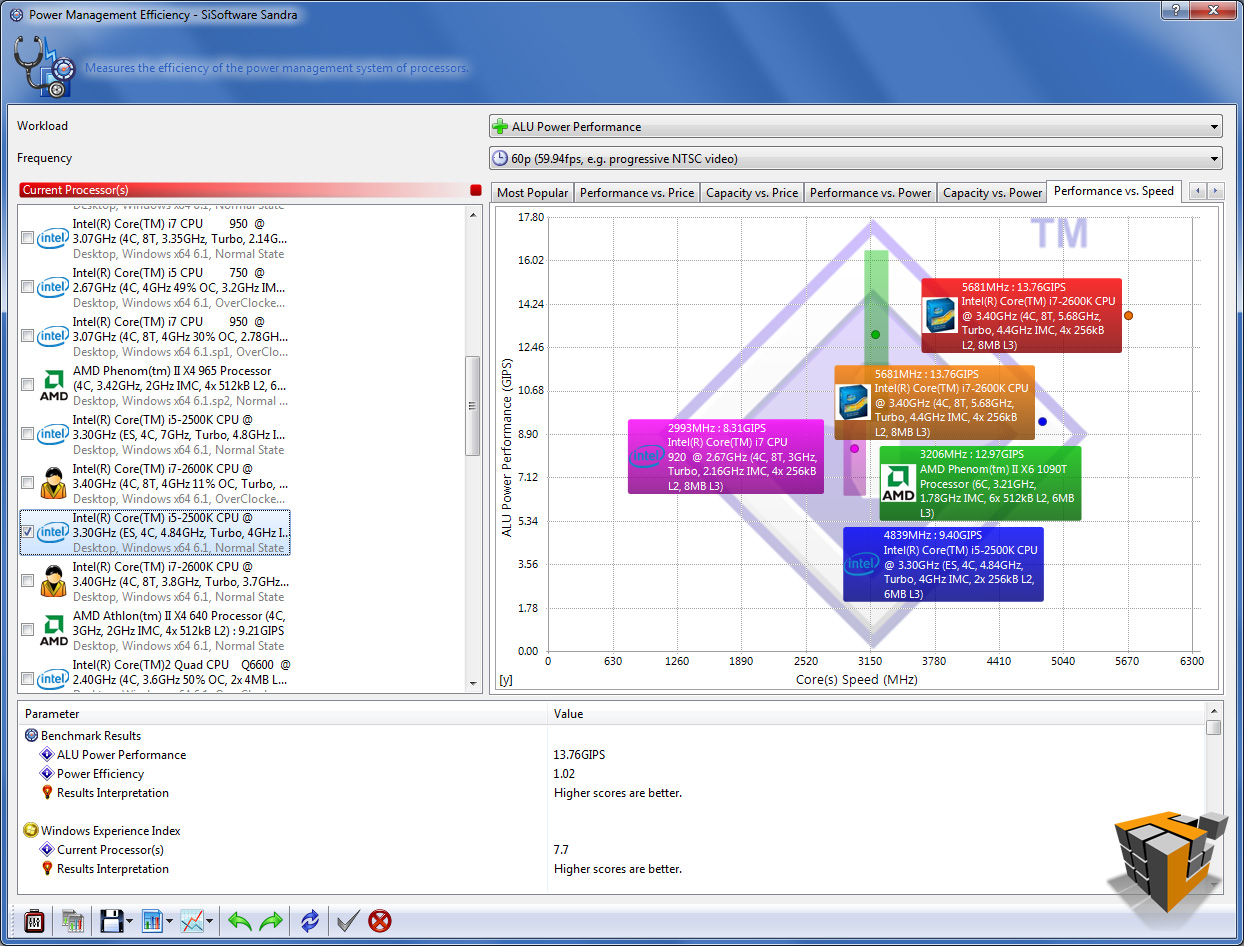
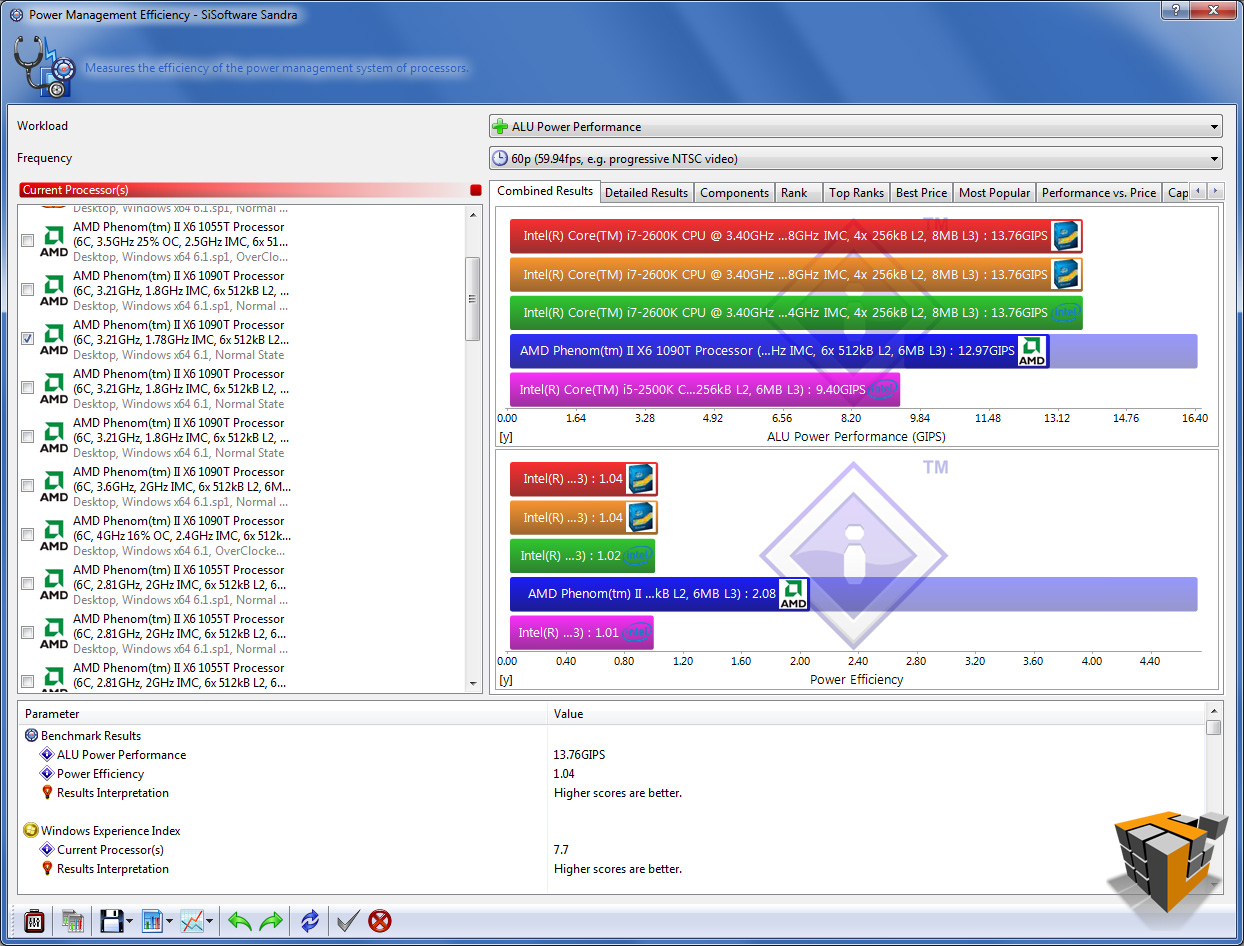
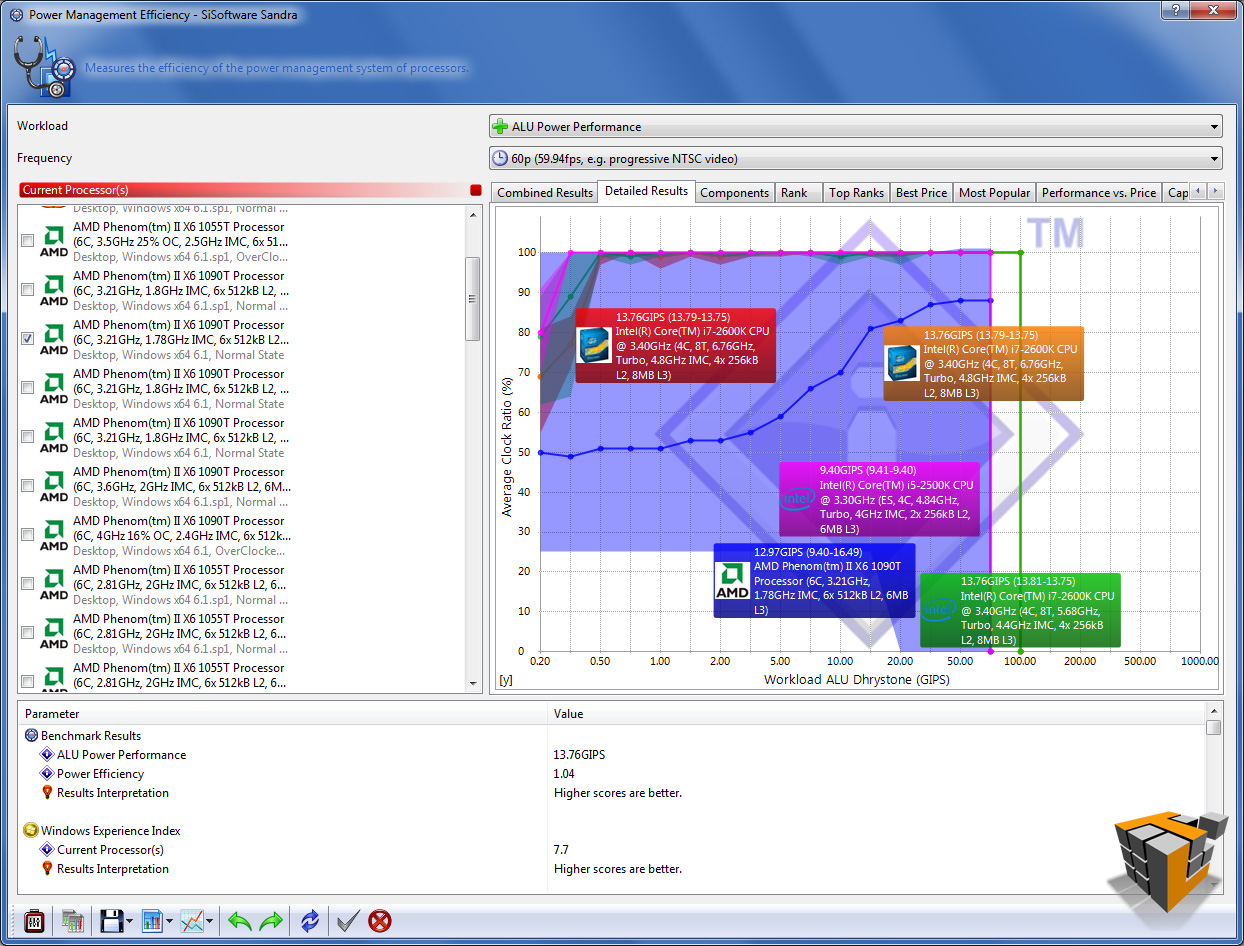
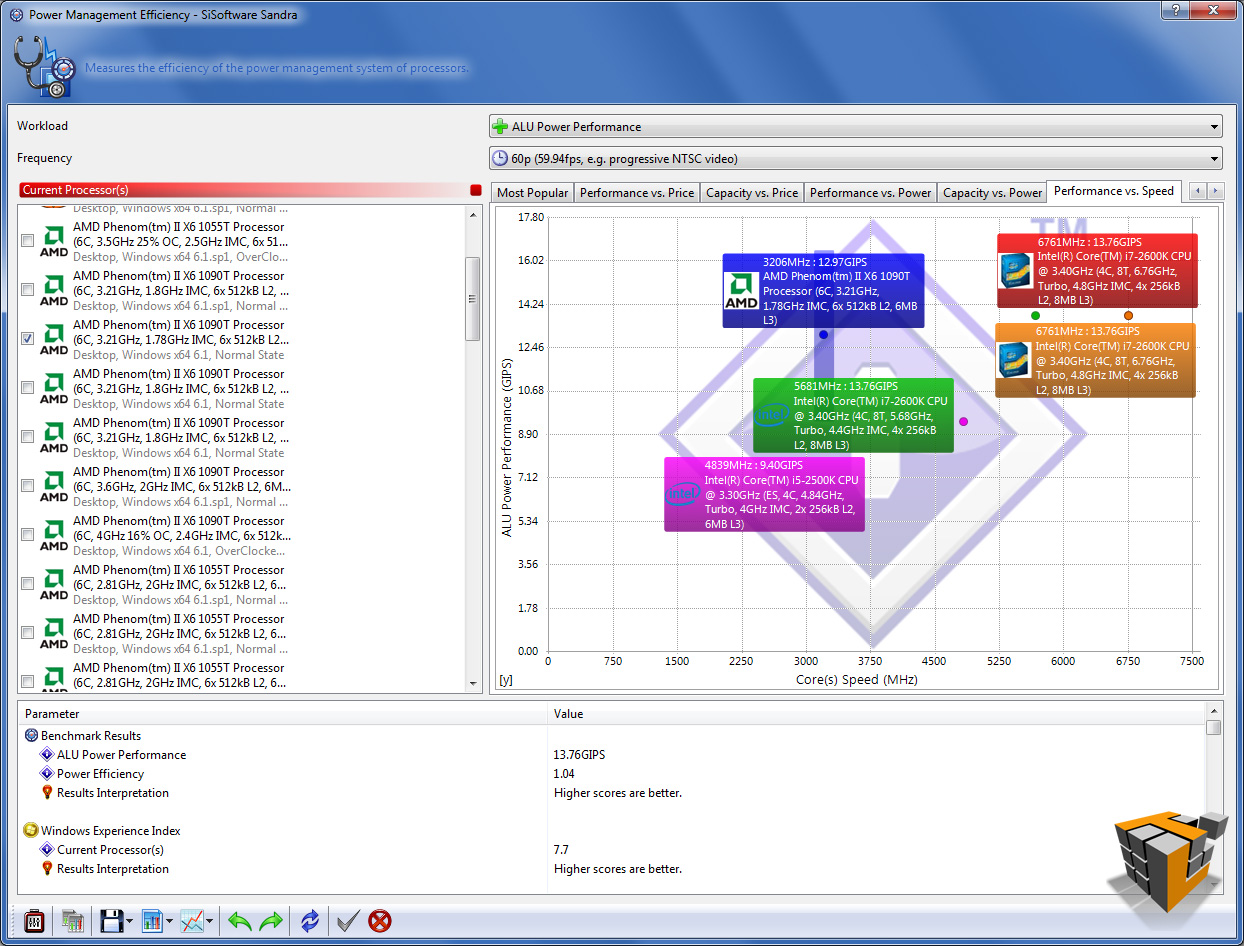
Power Management Efficiency: Benchmark the power management efficiency of the processors. Shows how efficient the power management of your processors is in comparison to other typical processors.The ability of the processors to step-down in frequency and voltage at different workloads is measured. The more a processor steps down in both frequency and voltage the better the score at the specific workload. The test stops when the workload is too great the processor even at 100% efficiency.
Multi-Core Efficiency: Benchmark the multi-core efficiency of the processors. Shows how efficient the processor cores and their inter-connects are in comparison to other types to other typical processors. The ability of the cores to process data blocks and pass them to another core for processing (producer-consumer paradigm) of different sizes and different chain sizes is measured. The efficiency of the inter-connect between cores is thus benchmarked; however, the number of cores (and processors) also counts as more data buffers can be processed simultaneously (aka “in flight”).
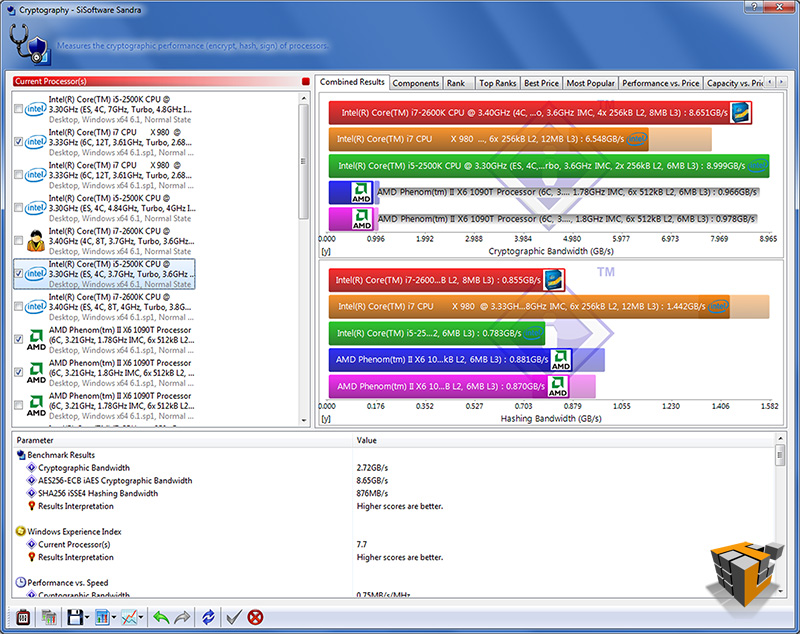
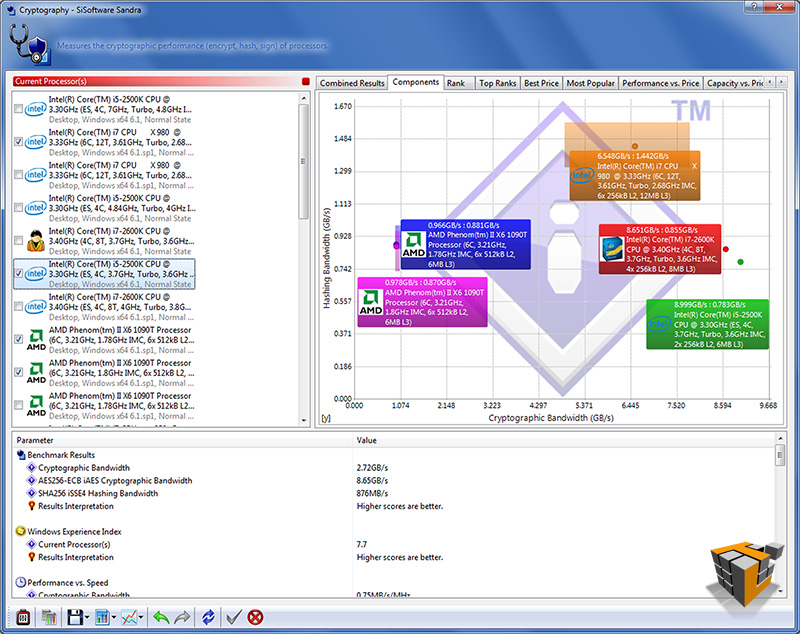
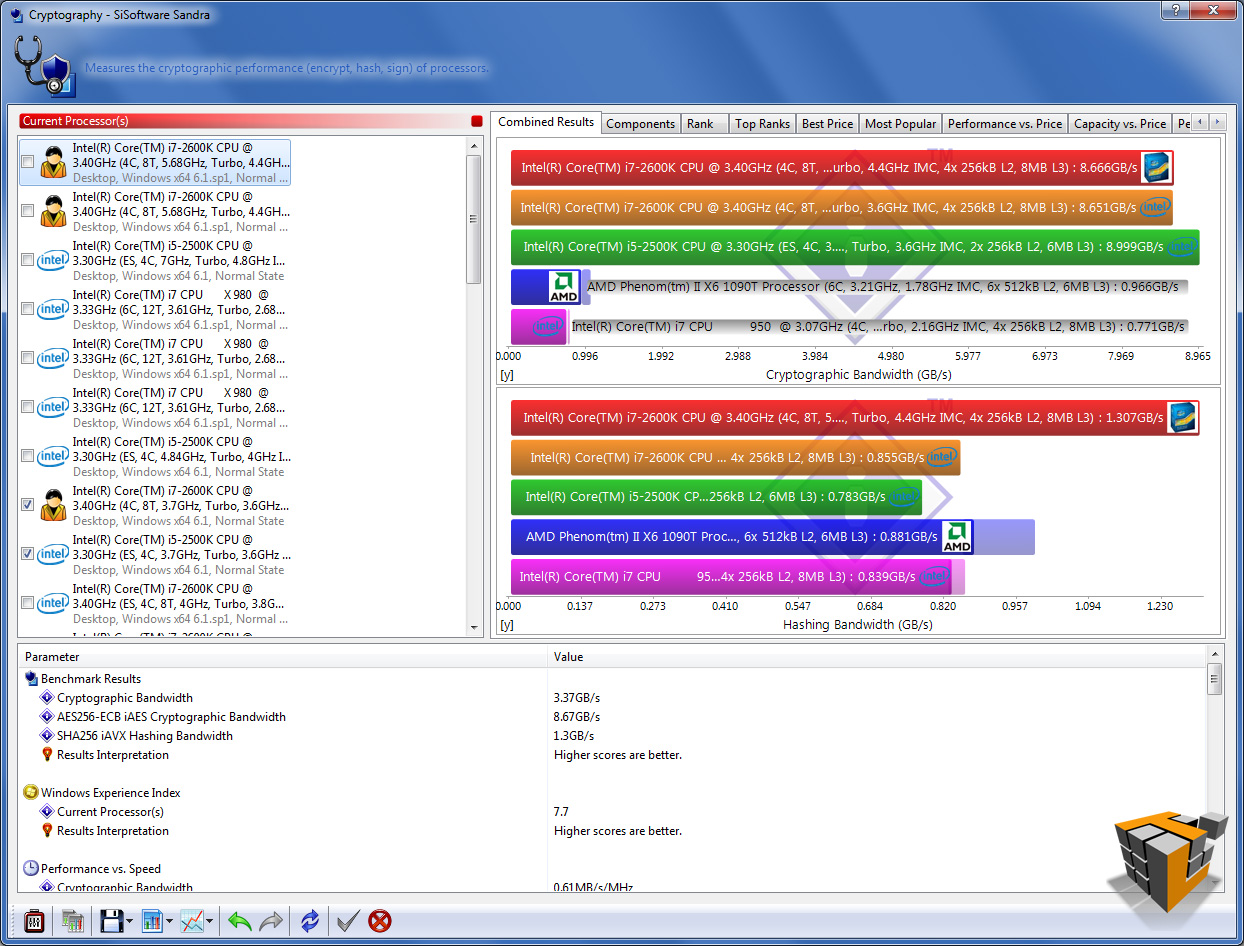
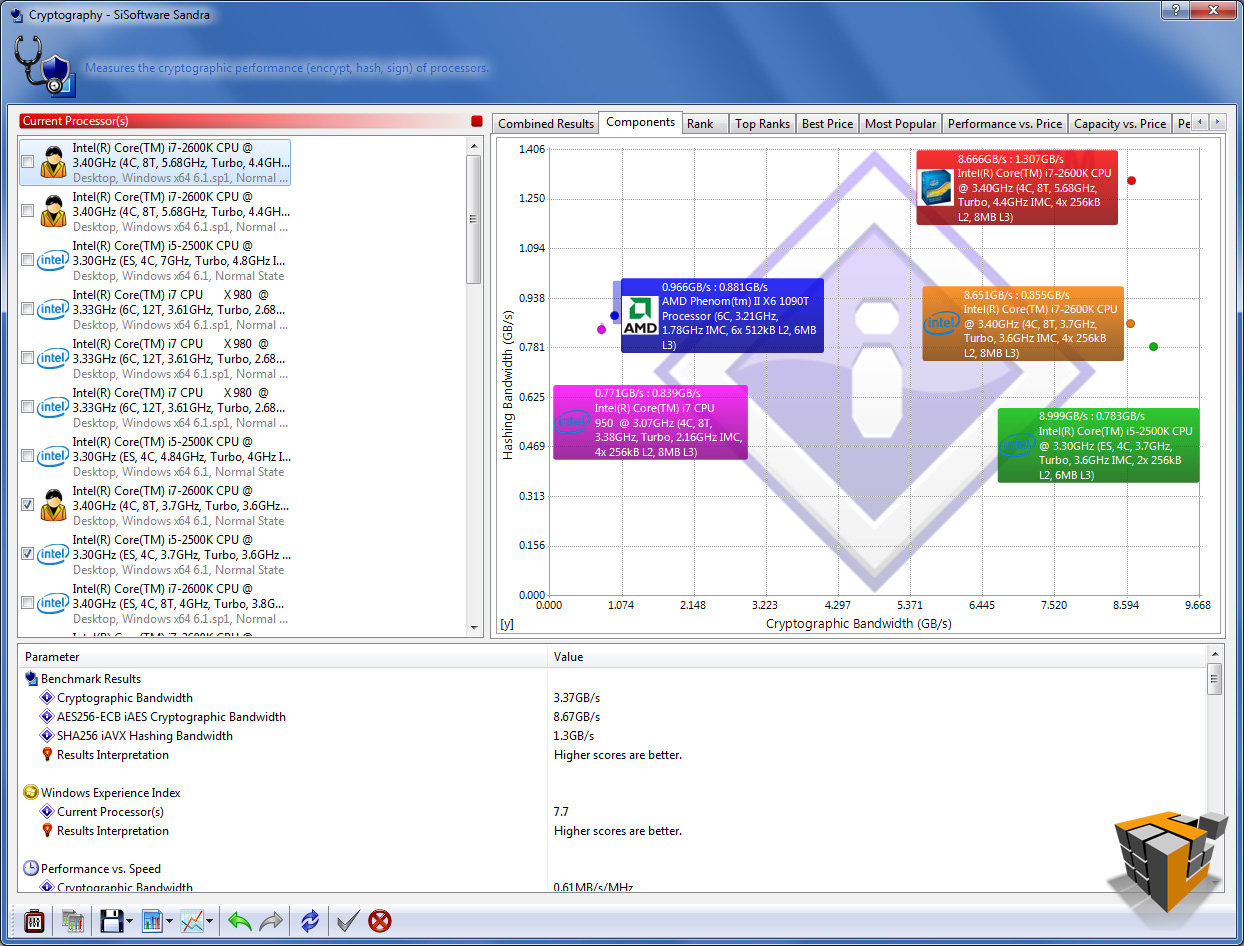
Cryptography: Measures the cryptography efficiency of the processor units: encryption, decryption and hashing. Shows how your processors handle cryptographic operations in comparison to other typical processors.
 |
 |
 |
| Processor Arithmetic | ||
 |
 |
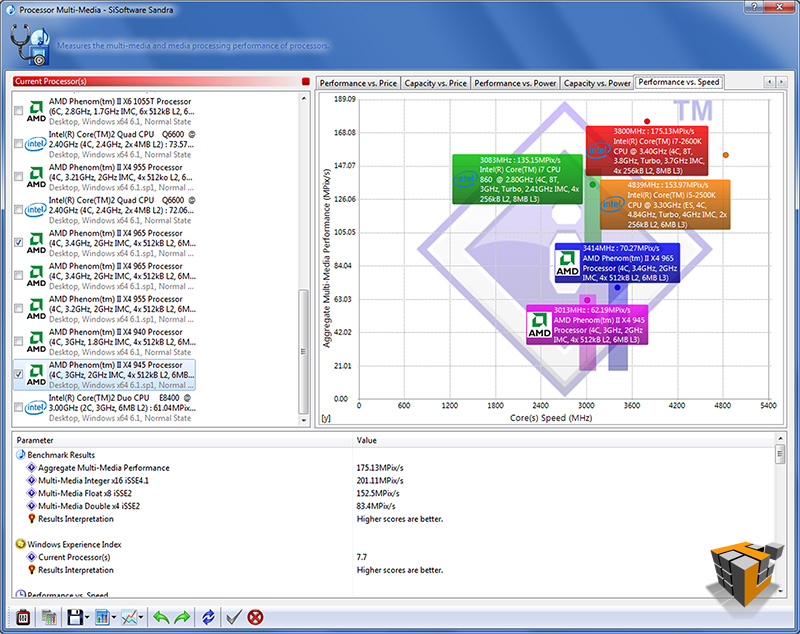 |
| Processor Multi-Media | ||
 |
 |
 |
| Multi-Core Efficiency | ||
 |
 |
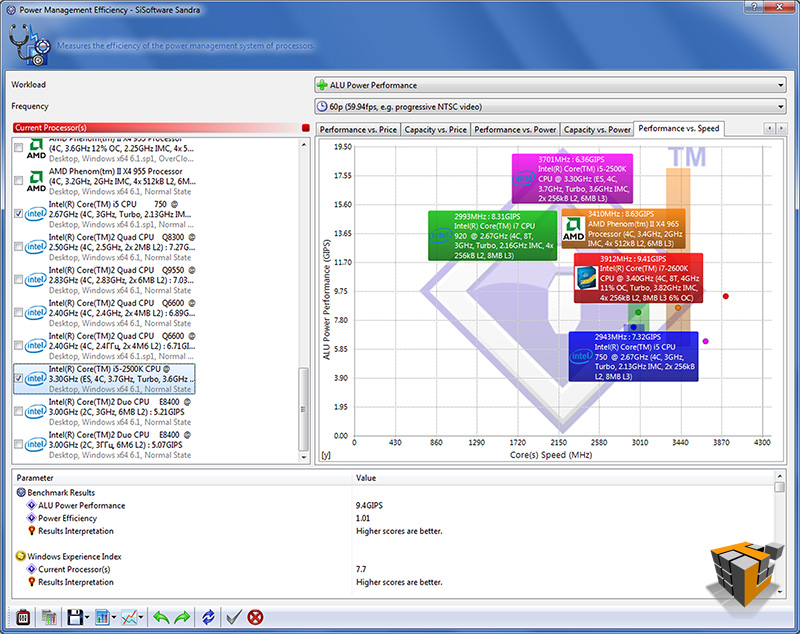 |
| Power Management Efficiency | ||
 |
 |
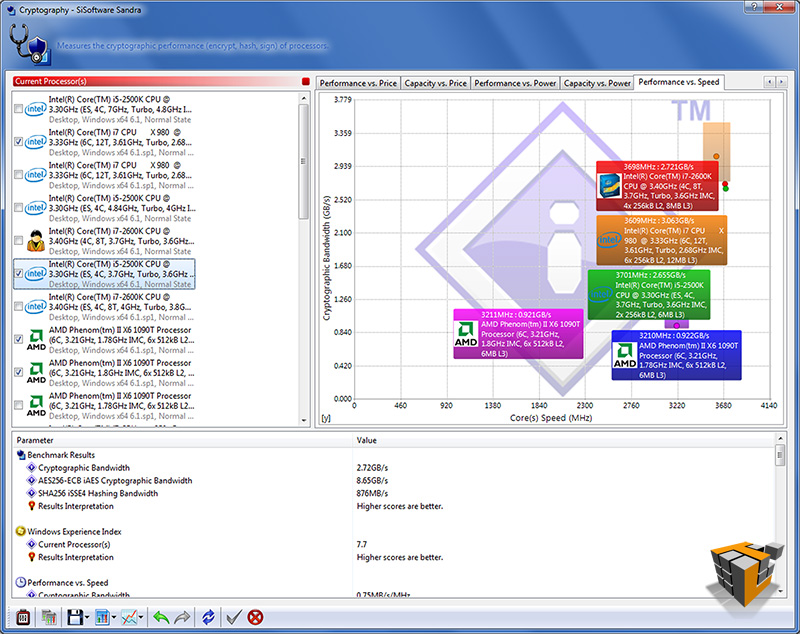 |
| Cryptography | ||
Overclock
Select 2nd Gen Core family processors delimited with a ‘K’ in the product identification are unlocked meaning the multiplier can be adjusted to change the overall CPU speed. Basically CPU speed = CPU Ratio (or multiplier) times Base clock frequency (or BCLK). Although the BCLK is able to adjust -/+ 10% it is best practice to leave it at the default and specified 100MHz.
Benchmarks – Overclocked to 4.40 Ghz
With a multiplier of 44 and a base clock of 100Mhz 44 x 100Mhz = 4400Mhz or 4.40 Ghz. With a 29% increase in clock speed the CPU averaged about 36C/97F doing basic word processing and web browsing. Now to put the processor to the test at 4.40 Ghz.

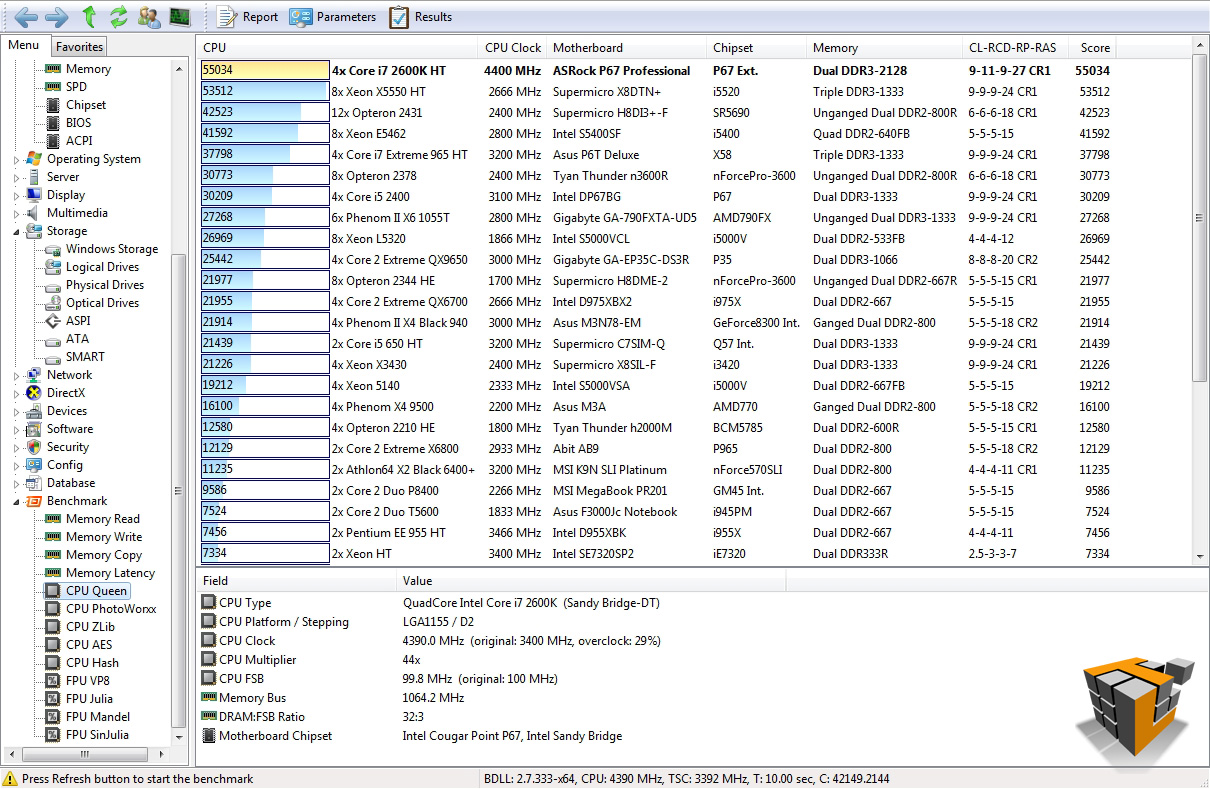
AIDA64 v1.50.1230
 |
 |
| CPU Queen – 1st
[2600K] 555034 vs 37775 [2500K] |
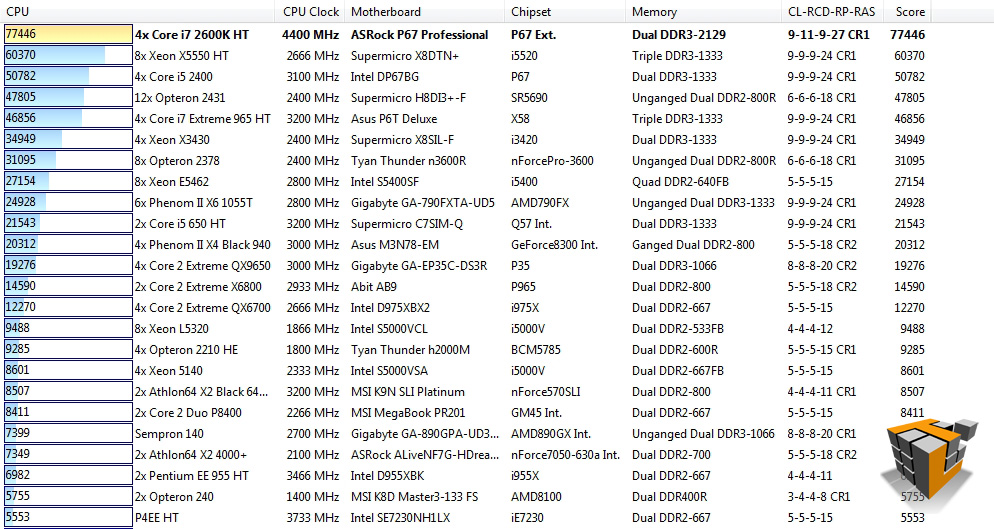
CPU PhotoWorxx – 1st
[2600K] 77446 vs 69903 [2500K] |
 |
 |
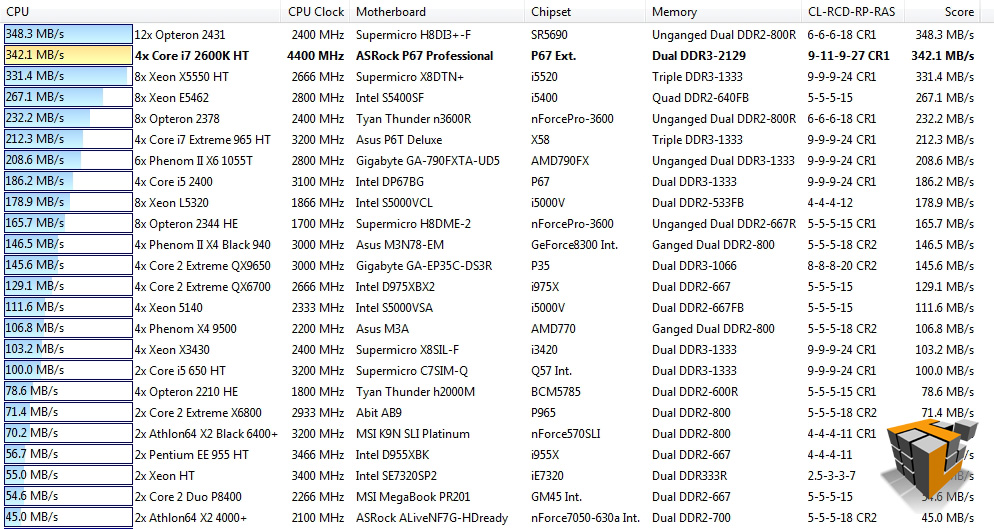
| CPU Zlib – 2nd
[2600K] 342.1 MB/s vs 233.6 MB/s [2500K] |
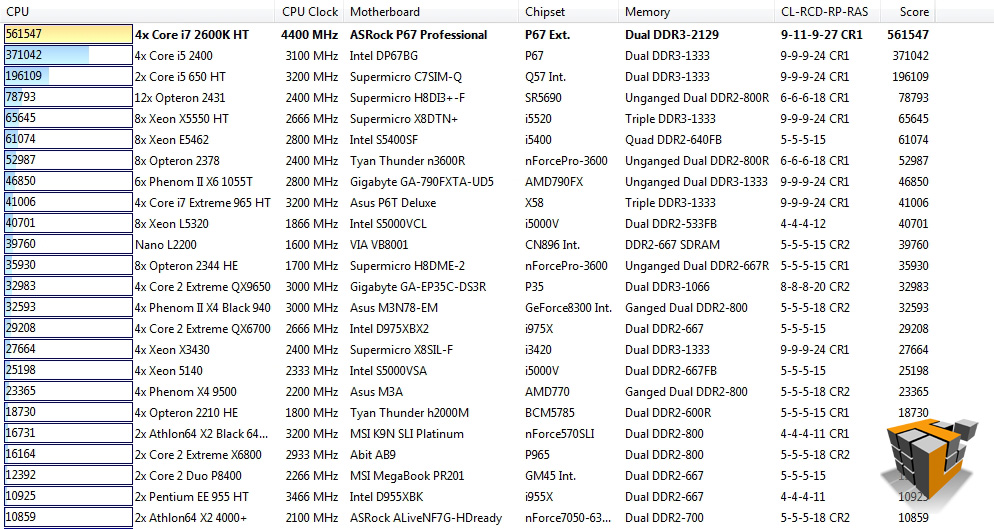
CPU AES – 1st
[2600K] 561547 vs 575612 [2500K] |
 |
|
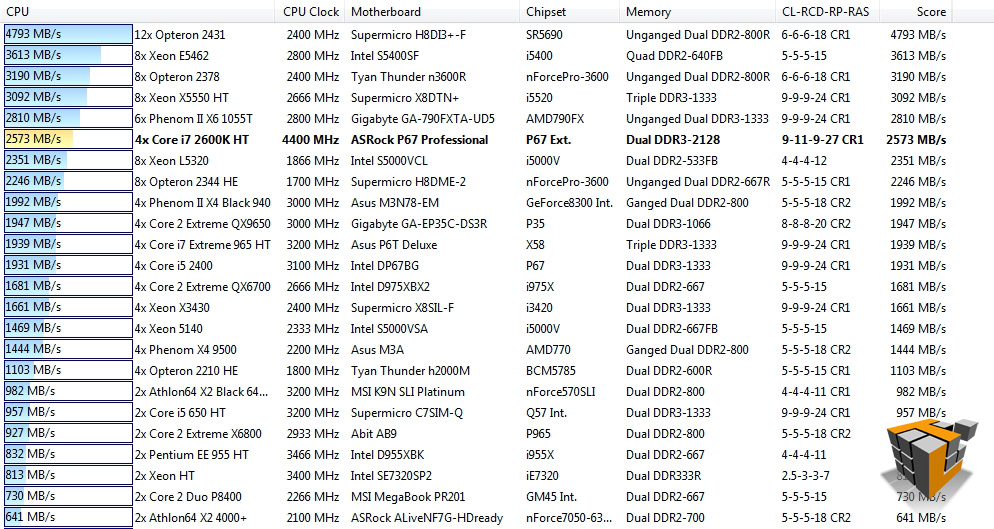
| CPU Hash – 6th
[2600K] 2573 MB/s vs 2316 MB/s [2500K] |
|
In our AIDA64 benchmarks we find improvements in scores in all 5 tests. Results in all tests move the i7-2600K to 1st place in all but 1 test, CPU Hash. The over-clocked 2600K remains a distance ahead of the over-clocked 2500K in all tests.
PCMark Vantage x64
 |
 |
| How the test was setup to run | Results – 13711 Marks; up from 12220 stock |
The 2600K overclock to 4.40 GHz gains ~1500 Marks in the PCMark Vantage test suite showing that even this small overclock will squeeze extra juice from the i7-2600K.
PerformanceTest v7.0
 |
 |
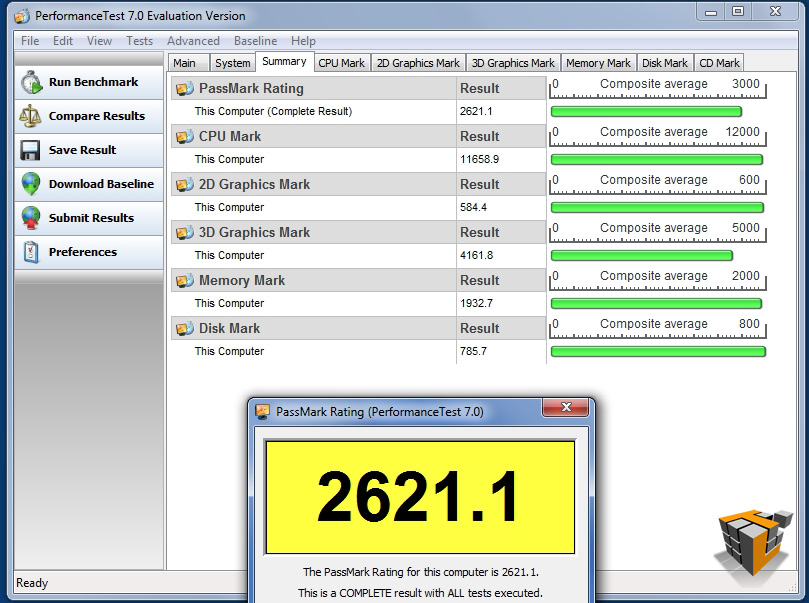
| PassMark Rating – 2621.1; up from 2297 .2 stock |
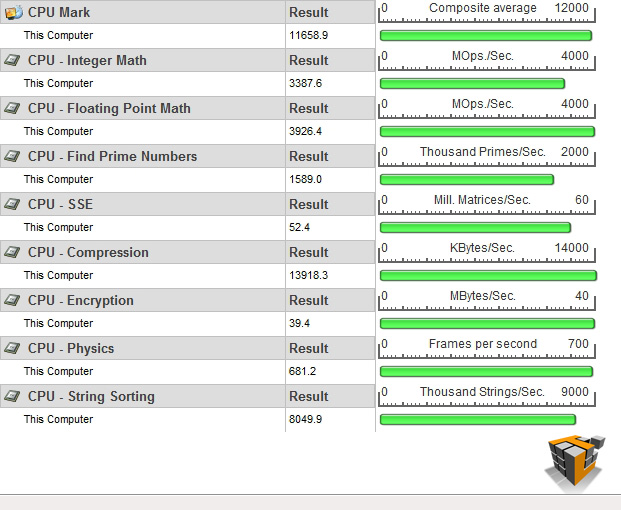
CPU Rating – 11658.9; up from 9390.8 stock |
| [2500K 8287.8] | |
 |
|
|
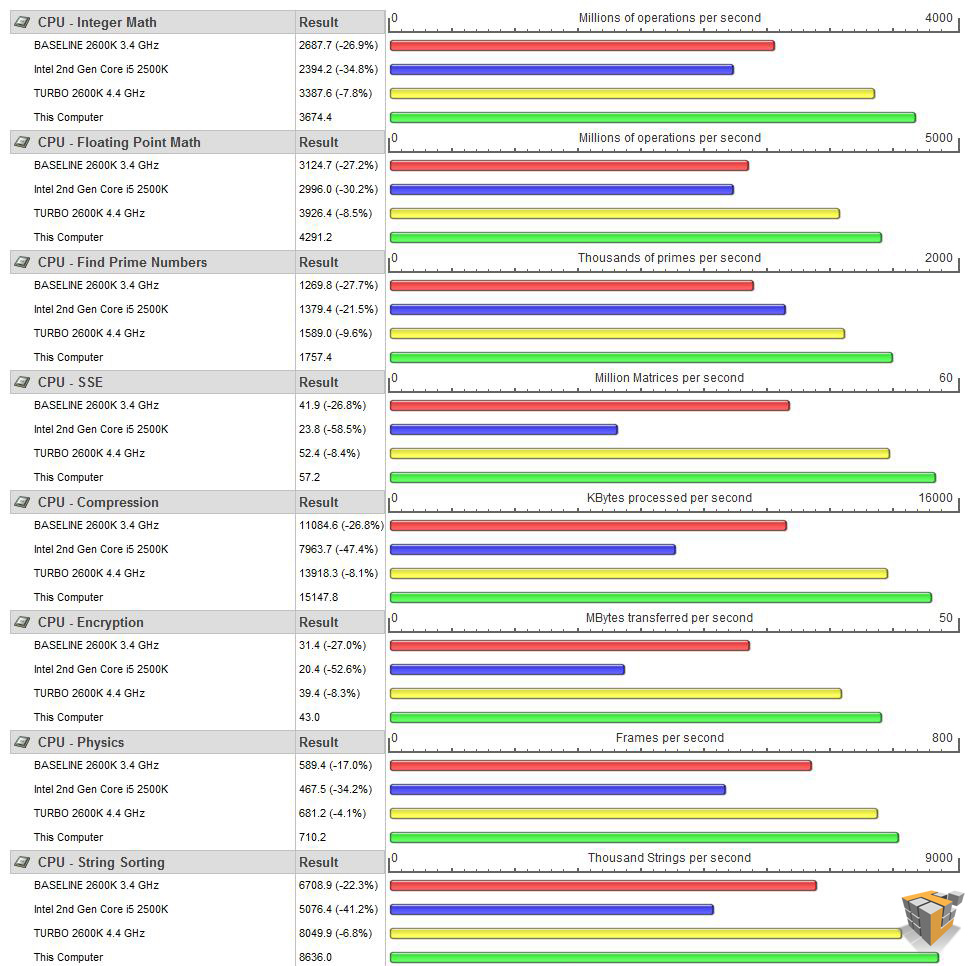
Detailed CPU comparison to i7 920, i5-2500K, i7-2600K Stock The OC Core i7-2600K is in green 1st in all categories, severely passing in some!
|
|
Overall we see about 14% increase in performance indicated by the PerformanceTest suite, not bad for a 29% overclock.
SiSoftware Sandra 2011c
 |
 |
 |
| Processor Arithmetic | ||
 |
 |
 |
| Processor Multi-Media | ||
 |
 |
 |
| Multi-Core Efficiency | ||
 |
 |
 |
| Power Management Efficiency | ||
 |
 |
 |
| Cryptography | ||
Benchmarks – Overclocked to 4.80 Ghz stable
You want more? OK how about we up the multiplier to 48 to give us a CPU speed of 4.80 GHz! This was the highest stable and reliably boot-able speed we were able to attain in testing. The CPU averaged about 40C/104F doing basic word processing and web browsing.
AIDA64 v1.50.1230
 |
 |
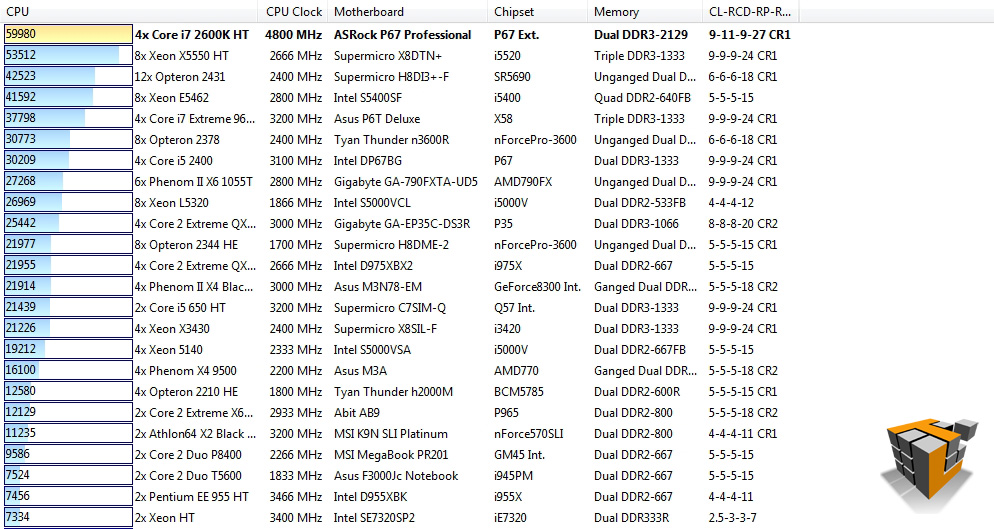
| CPU Queen – 1st
[2600K] 59980 vs 45325 [2500K] |
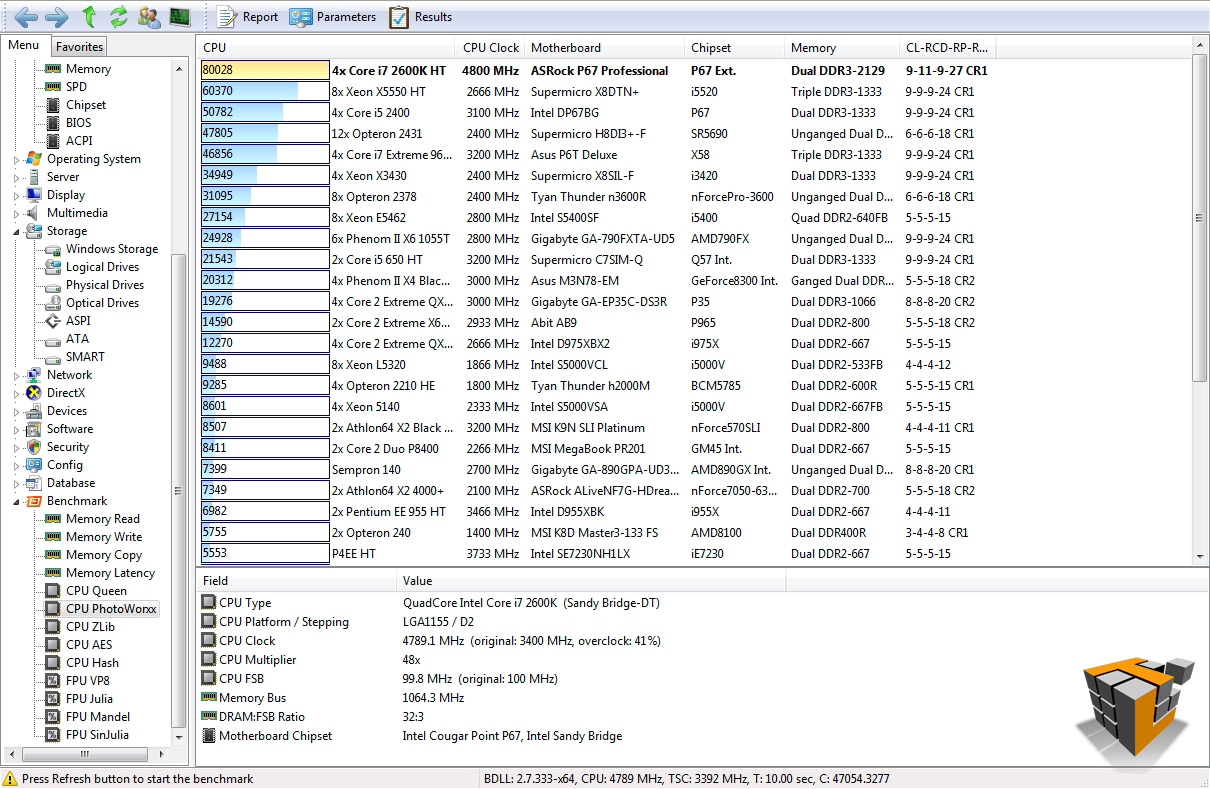
CPU PhotoWorxx – 1st
[2600K] 80028 vs 77887[2500K] |
 |
 |
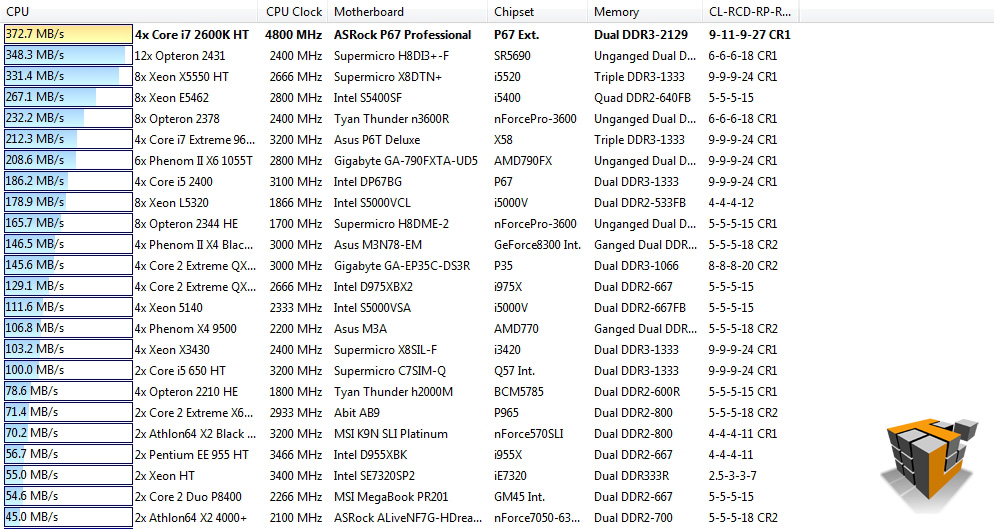
| CPU ZLib – 1st
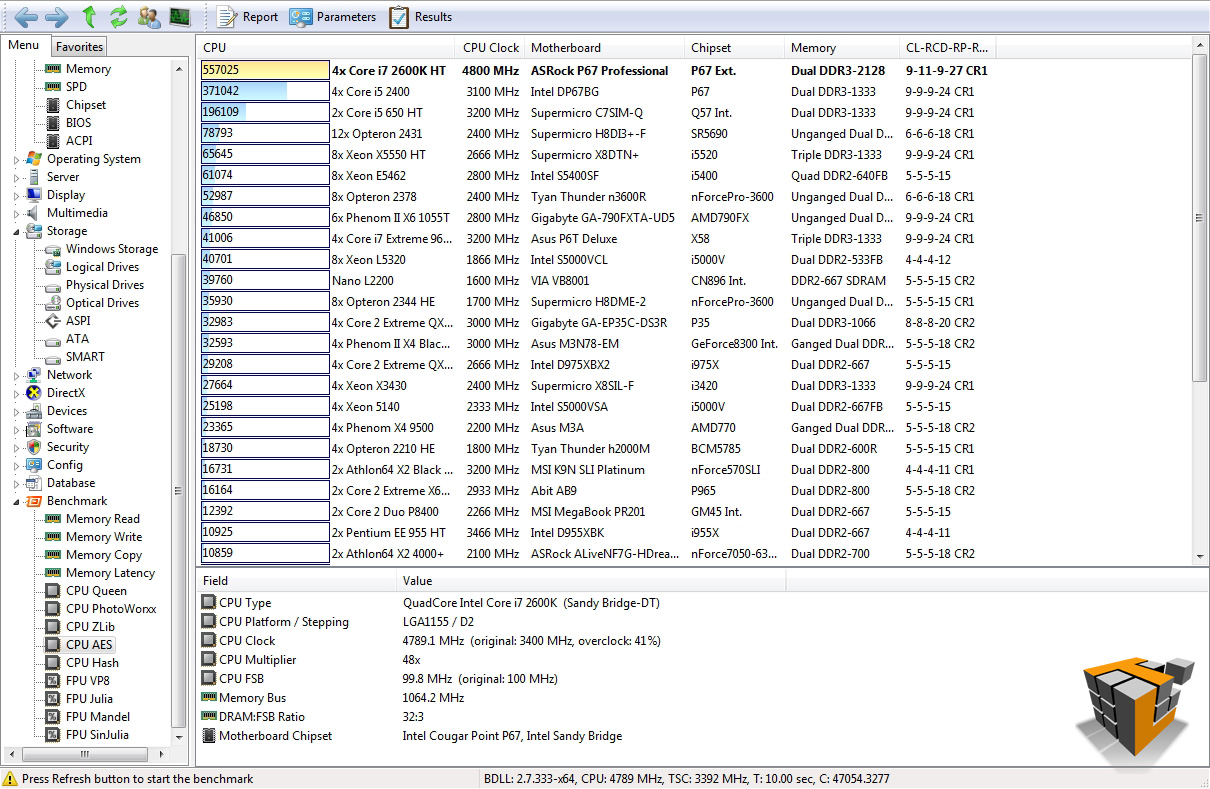
[2600K] 372.7 MB/s vs 279.8 MB/s [2500K] |
CPU AES – 1st
[2600K] 557025 vs 585860[2500K] |
 |
|
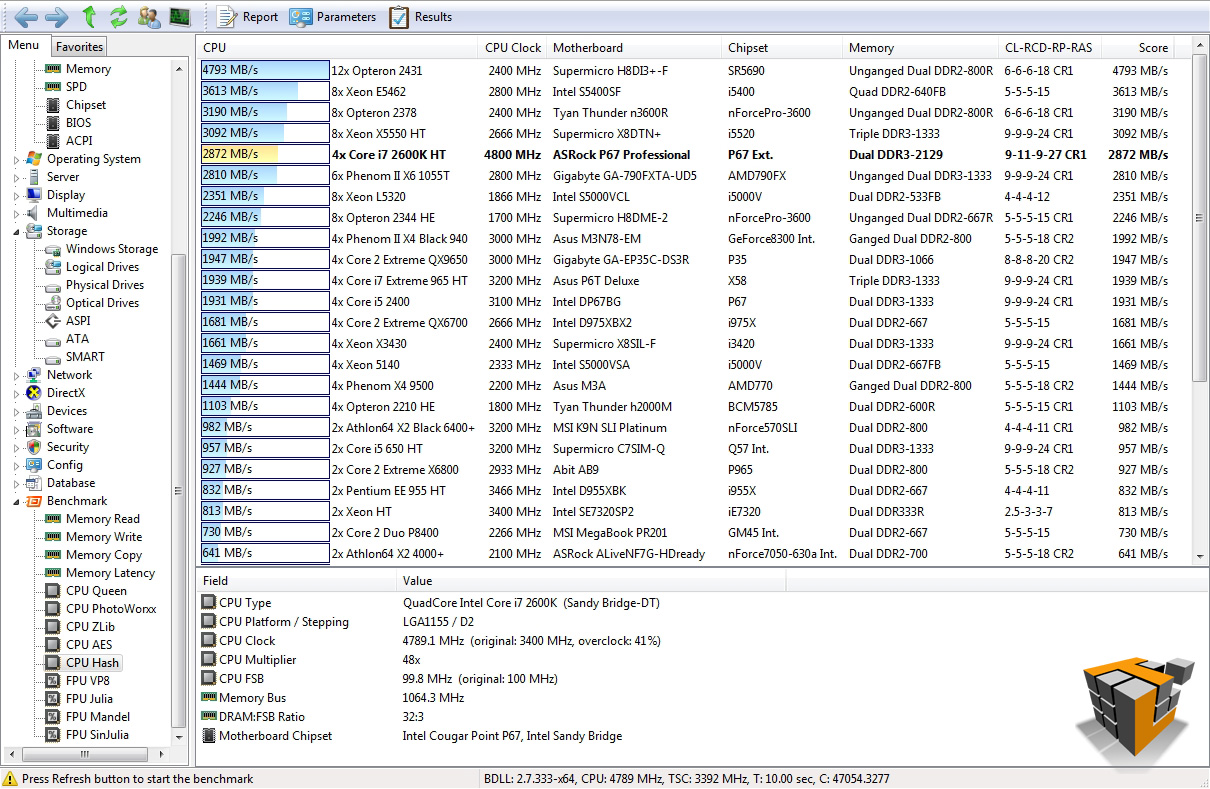
| CPU Hash – 5th
[2600K] 2872 MB/s vs 2779 MB/s [2500K] |
|
Still gaining ground in the AIDA64 suite at 4.80 GHz over-clocked! Interestingly the OC 2600K loses ground to the OC 2500K in the CPU AES test.
PCMark Vantage x64
 |
 |
| How the test was setup to run | Results – 14031 Marks |
The PCMark test shows steady performance increases over stock speed, another successful plus for the i7-2600K. The 2600K overclock to 4.80 GHz gains ~1800 Marks in the PCMark Vantage test suite over stock speed.
PerformanceTest v7.0
 |
 |
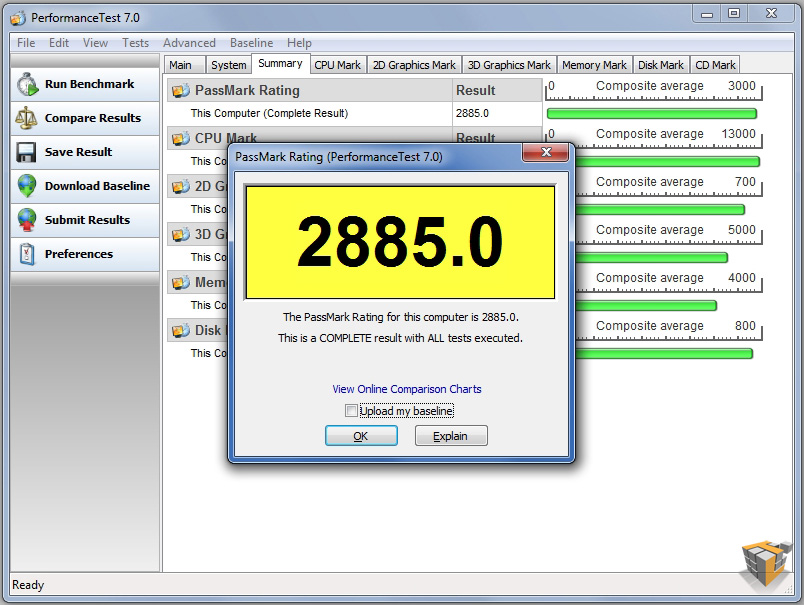
| PassMark Rating – 2885.0
Stock 3.40 GHz = 2297.2 [+25%] 4.0 GHz OC’d = 2621.1 [+10%] |
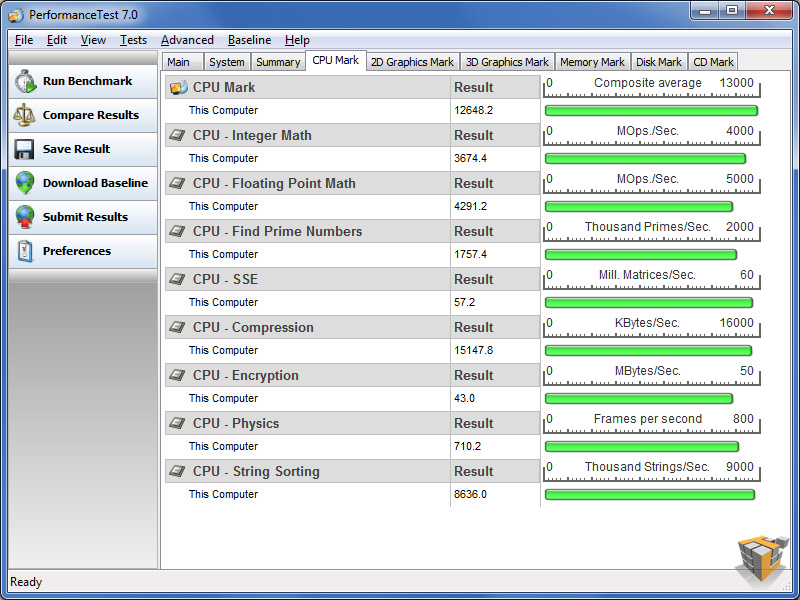
CPU Rating – 12648.2
Stock 3.40 GHz = 9390.8 [+35%] 4.0 GHz OC’d = 11658.9 [+8%] |
 |
|
|
Detailed CPU comparison to i5 2500K, i7-2600K Stock, i7-2600K OC 4.4 The OC Core i7 2600K is in green |
|
The 2600K beats out the competition and continues to show marked performance increases across the board with each step up the over-clock.
SiSoftware Sandra 2011c
The i7-2600K screams in all the Sandra benchmarks with steady increases over stock speed across the board.
 |
 |
 |
| Processor Arithmetic | ||
 |
 |
 |
| Processor Multi-Media | ||
 |
 |
 |
| Multi-Core Efficiency | ||
 |
 |
 |
| Power Management Efficiency | ||
 |
 |
 |
| Cryptography | ||
Summary
The speed and visibly smart performance of the 2nd Gen Core family makes this latest series of processors the top choice for any PC user. The i5 is the balance of price, performance, and features while the i7 series is the pro choice for the high end enthusiast. Today’s review CPU, the i7-2600K @ 3.4 GHz stock unlocked currently sells for $314.99 at NewEgg.com which is a fair amount of cash to spend on a processor. The stellar performance and ease of over-clocking definitely warrants the higher price tag. If you are going to invest in a long term high performance computer this CPU is the best current choice. This powerhouse is able to multi-task highly demanding applications without pause. The 2600K is a highly flexible workhorse that promises to provide extreme performance when needed and step down to save power during lighter usage. The i7 is an excellent choice for highly efficient raw horsepower and the flexibility to use the integrated GPU until budget allows for a dedicated option such as the Sapphire HD 6950

Conclusion
If you are on the fence between the i5-2500K and i7-2600K I would suggest pairing a Z68 chipset motherboard with the i7-2600K and wait a dozen or so paychecks to purchase your graphics card of choice. The inclusion of Intel Hyper Threading in the i7-2600K makes a world of difference in multi-threaded programming and multi-tasking. This CPU is designed to handle a range of demanding tasks, not just a couple of specific purposes. For example running several instances of virtual machines while encoding video and playing a HD video stream will stress the CPU, but the complex array of Intel technologies and raw performance potential of this CPU will handle the workload. Overall the i7-2600K is the choice processor if you want the best PC performance with the understanding that a higher investment now will net you a system that will be able to hop, skip, and jump for many years to come.


2600k @ 3.6, Turbo booster to 4 gigahertz, Msi P67a-gd65, Corsair Vengence 1600 8 gigs(1.5), Msi gtx 560 ti Frozr 2 overclocked. Very awesome system! Plays everything I throw at it! This system will last for years!